Volvo 2015 Annual Report Download - page 127
Download and view the complete annual report
Please find page 127 of the 2015 Volvo annual report below. You can navigate through the pages in the report by either clicking on the pages listed below, or by using the keyword search tool below to find specific information within the annual report.-
 1
1 -
2
-
3
-
4
-
5
-
6
-
7
-
8
-
9
-
10
-
11
-
12
-
13
-
14
-
15
-
16
-
17
-
18
-
19
-
20
-
21
-
22
-
23
-
24
-
25
-
26
-
27
-
28
-
29
-
30
-
31
-
32
-
33
-
34
-
35
-
36
-
37
-
38
-
39
-
40
-
41
-
42
-
43
-
44
-
45
-
46
-
47
-
48
-
49
-
50
-
51
-
52
-
53
-
54
-
55
-
56
-
57
-
58
-
59
-
60
-
61
-
62
-
63
-
64
-
65
-
66
-
67
-
68
-
69
-
70
-
71
-
72
-
73
-
74
-
75
-
76
-
77
-
78
-
79
-
80
-
81
-
82
-
83
-
84
-
85
-
86
-
87
-
88
-
89
-
90
-
91
-
92
-
93
-
94
-
95
-
96
-
97
-
98
-
99
-
100
-
101
-
102
-
103
-
104
-
105
-
106
-
107
-
108
-
109
-
110
-
111
-
112
-
113
-
114
-
115
-
116
-
 117
117 -
 118
118 -
 119
119 -
 120
120 -
 121
121 -
 122
122 -
 123
123 -
 124
124 -
 125
125 -
 126
126 -
 127
127 -
 128
128 -
 129
129 -
 130
130 -
 131
131 -
 132
132 -
 133
133 -
 134
134 -
 135
135 -
 136
136 -
 137
137 -
138
-
139
-
140
-
141
-
142
-
143
-
144
-
145
-
146
-
147
-
148
-
149
-
150
-
151
-
152
-
153
-
154
-
155
-
156
-
157
-
158
-
159
-
160
-
161
-
162
-
163
-
164
-
165
-
166
-
167
-
168
-
169
-
170
-
171
-
172
-
173
-
174
-
175
-
176
-
177
-
178
-
179
-
180
-
181
-
182
-
183
-
184
-
185
-
186
-
187
-
188
-
189
-
190
-
191
-
192
-
193
-
194
-
195
-
196
-
197
-
198
-
199
-
200
-
201
-
202
-
203
-
204
 |
 |
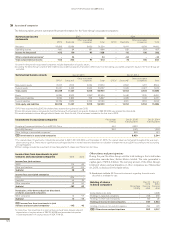
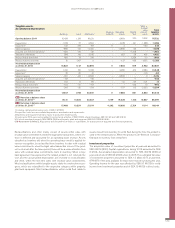
Operating segments are reported in a manner consistent with the internal
reporting provided to the chief operating decision-maker. The chief oper-
ating decision-maker, who is responsible for allocating resources and
assessing performance of the operating segments, has been identified as
the Group Executive Team that makes strategic decisions. The internal
reporting is provided based on the Group’s different business areas which
are Trucks, Construction Equipment, Buses, Volvo Penta, Governmental
Sales and Customer Finance. Volvo Rents, which was a separate business
area, was divested on January 31, 2014. The Volvo Group is per 31
December 2015 thereby organized in six business areas.
Each business area, except for Governmental Sales, is seen as a sepa-
rate segment. Governmental Sales is part of the Corporate functions,
Group functions and Other incl. eliminations segment.
As from January 1, 2015 the Trucks operations is structured according to
a functional approach, whereby the entire Trucks business is managed as
one single business area consisting of 3 different functional organizations:
Group Trucks Sales, Group Trucks Operations and Group Trucks Technology.
The Volvo Group has shared operations in both Trucks and Corporate
functions, Group functions and Other incl. eliminations. Purchasing,
powertrain, logistics and parts operations are part of the Trucks segment.
Volvo IT and Volvo Real Estate are treated as business support functions
and included in Corporate functions, Group functions and Other incl. elim-
inations. The cost of these operations is shared between the different
business areas based on utilization according to the principles of the
financial framework set by the Volvo Group.
As from March 1, 2016, the Volvo Group has a new organizational
structure (see page 79 in this report and page 181 in the Corporate Gov-
ernance report). The business will continue to be divided in six segments
under the new organization during 2016.
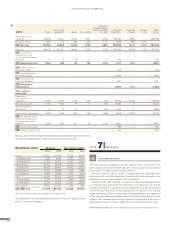
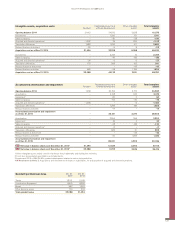
2015 Trucks Con struction
Equipment Buses Volvo Penta
Corporate
functions, Group
functions &
Other incl. elim. Industrial
Operations Customer
Finance Elimina-
tions Volvo
Group
Net sales, external
customers 212,060 50,717 22,818 9,137 7,145 301,878 10,636 – 312,515
Net sales, internal 1,918 291 762 269 –1,535 1,704 562 –2,265 –
I/S Net sales 213,978 51,008 23,580 9,406 5,610 303,582 11,199 –2,265 312,515
Expenses –194,320 –48,957 –22,643 –8,320 –7,886 –282,127 –9,193 2,265 –289,054
I/S Income from
investments in joint
ventures and associated
companies –141 –7 –77 0 82 –143 – – –143
I/S Operating income 19,517 2,044 860 1,086 –2,194 21,312 2,006 – 23,318
I/S Interest income
and similar credits 257 – – 257
I/S Interest expense
and similar charges –2,366 0 – –2,366
I/S Other financial
income and expense –792 0 – –792
I/S Income after
financial items 18,411 2,006 – 20,418
Other segment
information
Depreciation,
amortization and impairment –10,441 –1,986 –360 –281 494 –12,574 –4,233 – –16,807
Restructuring costs –2,034 –52 –23 –21 –216 –2,346 – – –2,346
Gains/losses from
divestments 61 2 – – 278 341 – – 341
Investments in fixed assets 6,707 1,112 259 277 817 9,173 10,239 – 19,412
B/S Investments in joint
ventures and associated
companies (the equity
method) 9,024 277 122 30 1,695 11,148 – – 11,148
B/S Assets held for sale 3,314 – – 3,314
B/S Liabilities held for sale –573 – – –573
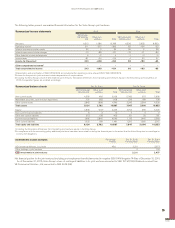
NOTE 6 SEGMENT REPORTING
GROUP PERFORMANCE 2015 NOTES
125