Volvo 2015 Annual Report Download - page 117
Download and view the complete annual report
Please find page 117 of the 2015 Volvo annual report below. You can navigate through the pages in the report by either clicking on the pages listed below, or by using the keyword search tool below to find specific information within the annual report.-
 1
1 -
2
-
3
-
4
-
5
-
6
-
7
-
8
-
9
-
10
-
11
-
12
-
13
-
14
-
15
-
16
-
17
-
18
-
19
-
20
-
21
-
22
-
23
-
24
-
25
-
26
-
27
-
28
-
29
-
30
-
31
-
32
-
33
-
34
-
35
-
36
-
37
-
38
-
39
-
40
-
41
-
42
-
43
-
44
-
45
-
46
-
47
-
48
-
49
-
50
-
51
-
52
-
53
-
54
-
55
-
56
-
57
-
58
-
59
-
60
-
61
-
62
-
63
-
64
-
65
-
66
-
67
-
68
-
69
-
70
-
71
-
72
-
73
-
74
-
75
-
76
-
77
-
78
-
79
-
80
-
81
-
82
-
83
-
84
-
85
-
86
-
87
-
88
-
89
-
90
-
91
-
92
-
93
-
94
-
95
-
96
-
97
-
98
-
99
-
100
-
101
-
102
-
103
-
104
-
105
-
106
-
 107
107 -
 108
108 -
 109
109 -
 110
110 -
 111
111 -
 112
112 -
 113
113 -
 114
114 -
 115
115 -
 116
116 -
 117
117 -
 118
118 -
 119
119 -
 120
120 -
 121
121 -
 122
122 -
 123
123 -
 124
124 -
 125
125 -
 126
126 -
 127
127 -
128
-
129
-
130
-
131
-
132
-
133
-
134
-
135
-
136
-
137
-
138
-
139
-
140
-
141
-
142
-
143
-
144
-
145
-
146
-
147
-
148
-
149
-
150
-
151
-
152
-
153
-
154
-
155
-
156
-
157
-
158
-
159
-
160
-
161
-
162
-
163
-
164
-
165
-
166
-
167
-
168
-
169
-
170
-
171
-
172
-
173
-
174
-
175
-
176
-
177
-
178
-
179
-
180
-
181
-
182
-
183
-
184
-
185
-
186
-
187
-
188
-
189
-
190
-
191
-
192
-
193
-
194
-
195
-
196
-
197
-
198
-
199
-
200
-
201
-
202
-
203
-
204
 |
 |

GROUP PERFORMANCE 2015 NOTES
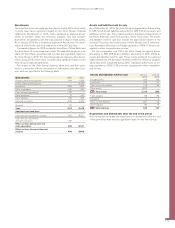
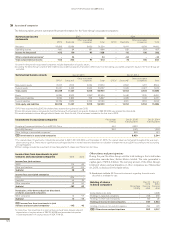
Divestments
The Volvo Group has not made any divestments during 2015, which solely
or jointly have had a significant impact on the Volvo Group’s financial
statements. Divestments in 2015 mainly pertained to planned divest-
ments of activities within the efficiency program. This also includes
divestments of operations with the main purpose to dispose fixed assets.
As of January 2016 this is treated as disposal of fixed assets. For clarifi-
cation of effect in the cash flow read more in Note 29 Cash flow.
Comparative figures for 2014 include the divestiture of Volvo Rents and
the divestment of commercial real estate. The adjusted purchase price
related to Volvo Rents divestment did not have any significant impact on
the Volvo Group in 2015. The Volvo Group did not make any other divest-
ments during 2014, which solely or jointly had a significant impact on the
Volvo Group’s financial statements.
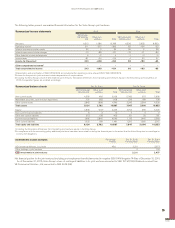
The impact on the Volvo Group’s balance sheet and cash flow state-
ment in connection with the divestment of subsidiaries and other busi-
ness units are specified in the following table:
Divestments 2015 2014
Property, plant and equipment –219 –1,584
Assets under operating lease – –5,475
Inventories –209 –221
Other receivables –156 –340
Cash and cash equivalents –187 –
Other provisions 13 –65
Other liabilities 479 206
Divested net assets –279 –7,479
Goodwill –23 –
Total –302 –7,479
Additional purchase price – –
Cash and cash equivalents received 595 8,501
Cash and cash equivalents,
divested companies –187 –
Effect on Volvo Group cash and
cash equivalents 408 8,501
Effect on Volvo Group net financial
position 498 8,868
Assets and liabilities held for sale
As of December 31, 2015, the Volvo Group recognized assets amounting
to SEK 3,314 M and liabilities amounting to SEK 573 M as assets and
liabilities held for sale. Those mainly pertain to the planned divestment of
the North American used truck business, Arrow Truck Sales. The assets
and liabilities held for sale also include the planned divestment of the
external IT business and outsourcing of Volvo Group’s own IT infrastruc-
ture. Translation differences on foreign operations of SEK 11 M were rec-
ognized in other comprehensive income.
For the comparative year 2014, the Volvo Group recognized assets
amounting to SEK 288 M and liabilities amounting to SEK 130 M as
assets and liabilities held for sale. Those mainly pertained to a planned
dealer divestment and divestment activities within the efficiency program
which have been completed during 2015. Translation differences on for-
eign operations of SEK 10 M were also recognized in other comprehen-
sive income.
Assets and liabilities held for sale Dec 31,
2015 Dec 31,
2014
Tangible assets 815 173
Inventories 519 21
Other current receivables 778 94
Other assets 1,202 –
B/S Total assets 3,314 288
Trade payables 86 87
Provisions 14 5
Other current liabilities 391 23
Other liabilities 82 15
B/S Total liabilities 573 130
Acquisitions and divestments after the end of the period
Volvo Group has not made any acquisitions or divestments after the end
of the period that have had any significant impact on the Volvo Group.
115