Volvo 2015 Annual Report Download - page 83
Download and view the complete annual report
Please find page 83 of the 2015 Volvo annual report below. You can navigate through the pages in the report by either clicking on the pages listed below, or by using the keyword search tool below to find specific information within the annual report.-
 1
1 -
2
-
3
-
4
-
5
-
6
-
7
-
8
-
9
-
10
-
11
-
12
-
13
-
14
-
15
-
16
-
17
-
18
-
19
-
20
-
21
-
22
-
23
-
24
-
25
-
26
-
27
-
28
-
29
-
30
-
31
-
32
-
33
-
34
-
35
-
36
-
37
-
38
-
39
-
40
-
41
-
42
-
43
-
44
-
45
-
46
-
47
-
48
-
49
-
50
-
51
-
52
-
53
-
54
-
55
-
56
-
57
-
58
-
59
-
60
-
61
-
62
-
63
-
64
-
65
-
66
-
67
-
68
-
69
-
70
-
71
-
72
-
 73
73 -
 74
74 -
 75
75 -
 76
76 -
 77
77 -
 78
78 -
 79
79 -
 80
80 -
 81
81 -
 82
82 -
 83
83 -
 84
84 -
 85
85 -
 86
86 -
 87
87 -
 88
88 -
 89
89 -
 90
90 -
 91
91 -
 92
92 -
 93
93 -
94
-
95
-
96
-
97
-
98
-
99
-
100
-
101
-
102
-
103
-
104
-
105
-
106
-
107
-
108
-
109
-
110
-
111
-
112
-
113
-
114
-
115
-
116
-
117
-
118
-
119
-
120
-
121
-
122
-
123
-
124
-
125
-
126
-
127
-
128
-
129
-
130
-
131
-
132
-
133
-
134
-
135
-
136
-
137
-
138
-
139
-
140
-
141
-
142
-
143
-
144
-
145
-
146
-
147
-
148
-
149
-
150
-
151
-
152
-
153
-
154
-
155
-
156
-
157
-
158
-
159
-
160
-
161
-
162
-
163
-
164
-
165
-
166
-
167
-
168
-
169
-
170
-
171
-
172
-
173
-
174
-
175
-
176
-
177
-
178
-
179
-
180
-
181
-
182
-
183
-
184
-
185
-
186
-
187
-
188
-
189
-
190
-
191
-
192
-
193
-
194
-
195
-
196
-
197
-
198
-
199
-
200
-
201
-
202
-
203
-
204
 |
 |

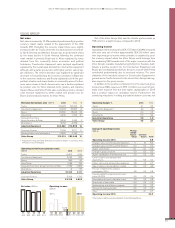
Net sales
Net sales increased by 10.4% explained predominantly by positive
currency impact mainly related to the appreciation of the USD
towards SEK. Excluding the currency impact there were slightly
increased sales for Trucks where the increased volumes in primar-
ily North America and Western Europe was to great extent offset
by the sharp decline in South America following the continued
weak market in primarily Brazil and in Africa explained by lower
demand from the commodity driven economies and political
turbulence. Construction Equipment sales declined significantly
explained by the overall weak demand for construction equipment
although with a better product mix with higher portion sale of big-
ger machines. The volume decrease was explained by significant
decrease in China following the economic slowdown in Brazil due
to the economic weakness and Russia explained by both the geo-
political situation and sharp decline in commodity prices. Further-
more sales volume in North America also saw a decline explained
by product exits for Volvo branded motor graders and backhoe
loaders. Buses and Volvo Penta sales excluding currency showed
solid increase explained by better market and product mix for
Buses and increased volumes for Volvo Penta.
Out of the Volvo Group total sale the Vehicle portion made up
75% which is a slight increase compared to 2014.
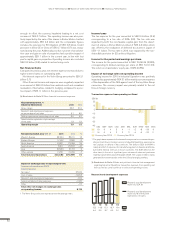
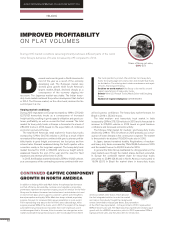
Operating income
Operating income increased by SEK 17.5 billion (300%) compared
with prior year out of which approximately SEK 8.9 billion came
from improved gross income which primarily is explained by posi-
tive currency impact where the Volvo Group could leverage from
the weakening SEK towards most of the major currencies with the
Volvo Group’s sizeable manufacturing footprint in Sweden. Addi-
tionally a positive product mix for Construction Equipment and
Buses also contributed positively to the gross income while Penta
contributed predominantly due to increased volumes. The lower
utilization of the industrial system for Construction Equipment in
general and in South America for the whole Volvo Group had neg-
ative impact on the gross income.
In addition to the positive contribution from the improved gross
income lower R&D expenses of SEK 1.3 billion as a result of gen-
erally lower expense level but also higher capitalization in 2015
had a positive impact on operating income. Furthermore the
underlying reductions in selling and administration costs was not
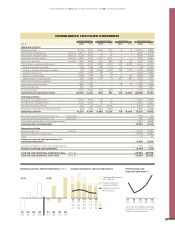
Net sales by business area, SEK M 2015 2014 %
Trucks 213,978 190,904 12
Construction Equipment 51,008 52,855 –3
Buses 23,580 18,645 26
Volvo Penta 9,406 7,790 21
Corporate Functions,
Group Functions & Other 8,346 8,162 2
Eliminations –2,736 –2,356 –
Industrial Operations1303,582 275,999 10
Customer Finance 11,199 10,111 11
Reclassifications and eliminations –2,265 –3,162 –
Volvo Group 312,515 282,948 10
1 Adjusted for acquired and divested units and changes in currency rates,
net sales was unchanged.
Operating income/loss by business area,
SEK M 2015 2014
Trucks 19,517 4,157
Construction Equipment 2,044 652
Buses 860 92
Volvo Penta 1,086 724
Corporate Functions, Group Functions & Other –2,189 –1,689
Eliminations –6 176
Industrial Operations 21,312 4,111
Customer Finance 2,006 1,712
Volvo Group 23,318 5,824
Change in operating income,
SEK bn
Change
(exclud-
ing cur-
rency)
Currency
impact Total
Operating income 2014 5.8
Change in gross income Industrial Operations 1.1 7.4 8.5
Change in gross income Customer Finance 0.4 0.0 0.4
Higher credit losses
1–0.1 –0.1 –0.2
Change in group structure 0.0 0.0 0.0
Higher capitalization of development cost 0.9 0.0 0.9
Lower research and development
expenditures 1.0 –0.6 0.4
Higherselling and administrative expenses 0.8 –1.5 –0.7
Sale of shares in Eicher Motors Limited 4.6 0.0 4.6
Provision related to EU antitrust
investigation 2014 3.8 0.0 3.8
Provision related to engine emission case
in the U.S 2014 0.4 0.0 0.4
Favourable outcome in arbitration case 0.8 0.0 0.8
Divestment of real estate –0.4 0.0 –0.4
Restructuringand efficiency program 0.2 0.0 0.2
Volvo profit sharing program –0.5 0.0 –0.5
Other –0.6 –0.1 –0.7
Operating income 2015 23,3
1 The higher credit losses are related to Industrial Operations.
Operating margin, % 2015 2014
Trucks 9.1 2.2
Construction Equipment 4.0 1.2
Buses 3.6 0.5
Volvo Penta 11.5 9.3
Industrial Operations 7.0 1.5
Volvo Group 7.5 2.1
Net sales, SEK bn
1211
310 300
13
273
14
283
15
313
Operating income,
SEK M
2014
Q3
2,250
Q2
3,563
Q1
2,269
Q4
–2,258
Q3 Q4
4,653 4,511
Q2
7,317
Q1
6,837
2015
GROUP PERFORMANCE BOARD OF DIRECTORS’ REPORT 2015 FINANCIAL PERFORMANCE
VOLVO GROUP
81