Volvo 2015 Annual Report Download - page 157
Download and view the complete annual report
Please find page 157 of the 2015 Volvo annual report below. You can navigate through the pages in the report by either clicking on the pages listed below, or by using the keyword search tool below to find specific information within the annual report.-
 1
1 -
2
-
3
-
4
-
5
-
6
-
7
-
8
-
9
-
10
-
11
-
12
-
13
-
14
-
15
-
16
-
17
-
18
-
19
-
20
-
21
-
22
-
23
-
24
-
25
-
26
-
27
-
28
-
29
-
30
-
31
-
32
-
33
-
34
-
35
-
36
-
37
-
38
-
39
-
40
-
41
-
42
-
43
-
44
-
45
-
46
-
47
-
48
-
49
-
50
-
51
-
52
-
53
-
54
-
55
-
56
-
57
-
58
-
59
-
60
-
61
-
62
-
63
-
64
-
65
-
66
-
67
-
68
-
69
-
70
-
71
-
72
-
73
-
74
-
75
-
76
-
77
-
78
-
79
-
80
-
81
-
82
-
83
-
84
-
85
-
86
-
87
-
88
-
89
-
90
-
91
-
92
-
93
-
94
-
95
-
96
-
97
-
98
-
99
-
100
-
101
-
102
-
103
-
104
-
105
-
106
-
107
-
108
-
109
-
110
-
111
-
112
-
113
-
114
-
115
-
116
-
117
-
118
-
119
-
120
-
121
-
122
-
123
-
124
-
125
-
126
-
127
-
128
-
129
-
130
-
131
-
132
-
133
-
134
-
135
-
136
-
137
-
138
-
139
-
140
-
141
-
142
-
143
-
144
-
145
-
146
-
 147
147 -
 148
148 -
 149
149 -
 150
150 -
 151
151 -
 152
152 -
 153
153 -
 154
154 -
 155
155 -
 156
156 -
 157
157 -
 158
158 -
 159
159 -
 160
160 -
 161
161 -
 162
162 -
 163
163 -
 164
164 -
 165
165 -
 166
166 -
 167
167 -
168
-
169
-
170
-
171
-
172
-
173
-
174
-
175
-
176
-
177
-
178
-
179
-
180
-
181
-
182
-
183
-
184
-
185
-
186
-
187
-
188
-
189
-
190
-
191
-
192
-
193
-
194
-
195
-
196
-
197
-
198
-
199
-
200
-
201
-
202
-
203
-
204
 |
 |
GROUP PERFORMANCE 2015 NOTES
155
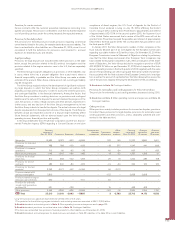
Carrying amounts and fair values on Financial Instruments Dec 31, 2015 Dec 31, 2014
SEK M Carrying
value Fair
value Carrying
value Fair
value
Assets
Financial assets at fair value through the income statement
The Volvo Group’s outstanding interest and currency risk derivatives4Note 16 2,622 2,622 2,877 2,877
The Volvo Group's outstanding raw material derivatives Note 16 6 6 3 3
Other derivatives5564 564 564 564
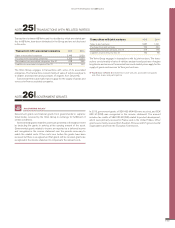
B/S Marketable securities Note 18 3,344 3,344 7,312 7,312
6,536 6,536 10,756 10,756
Loans receivable and other receivables
B/S Accounts receivable Note 16 29,101 – 30,895 –
Customer financing receivables1Note 15 102,583 – 99,166 –
Other interest-bearing receivables Note 16 1,482 – 976 –
133,166 – 131,037 –
Financial assets available for sale
Holding of sharesin listed companies Note 5 507 507 4,543 4,543
Holding of sharesin non-listed companies Note 5 396 – 474 –
904 507 5,017 4,543
B/S Cash and cash equivalents Note 18 21,048 21,048 26,242 26,242
Liabilities Note 22
Financial liabilities at fair value through the income statement
The Volvo Group’soutstanding interest and currency risks derivatives21,711 1,711 1,597 1,597
The Volvo Group’s outstanding raw material derivatives 68 68 23 23
1,779 1,779 1,620 1,620
Financial liabilities valued at amortized cost3
Long term bond loans and other loans 74,691 78,576 107,495 112,564
Short term bank loans and other loans 56,521 56,056 39,498 39,488
131,211 134,632 146,993 152,052
B/S Trade Payables 55,648 – 56,647 –
1 Volvo does not estimate the risk premium for the customer financing receivables
and chooses therefore not to disclose fair value for this category.
2 Includes a fair value of a loan related to hedge accounting amounting to SEK
neg 611 M (neg 1,022), netted against derivatives used to hedge the risk
amounting to SEK 616 M (1,032). For further information see section hedge
accounting below. Refer to footnote 4.
3 In the Volvo Group consolidated financial position, financial liabilities include
loan-related derivatives amounting to SEK –1,395 M (–991). The credit risk is
included in the fair value of loans.
4 The Volvo Group’s gross exposure from positive derivatives amounted to SEK
3,237 M (3,909). The exposure is the sum of positive derivatives reported as
assets to an amount of SEK 2,622 M (2,877) and positive derivatives of SEK
616 M (1,032) reported as a liability, netted against a negative fair value of a
loan. Refer to footnote 2. The gross exposure is reduced by 53% (60%) bynet-
ting agreements and cash deposits to SEK 1,531 M (1,582).
5. The input data used in the valuation model for calculating the fair value has not
changed during 2015.
Read more in Note 4 about Goals and policies in financial risk management.
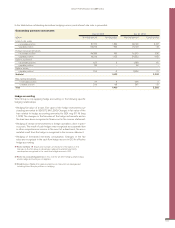
Information regarding carrying amounts and fair values
In the table below, carrying amounts are compared with fair values for all of the Volvo Group’s financial instruments.