Volvo 2015 Annual Report Download - page 85
Download and view the complete annual report
Please find page 85 of the 2015 Volvo annual report below. You can navigate through the pages in the report by either clicking on the pages listed below, or by using the keyword search tool below to find specific information within the annual report.-
 1
1 -
2
-
3
-
4
-
5
-
6
-
7
-
8
-
9
-
10
-
11
-
12
-
13
-
14
-
15
-
16
-
17
-
18
-
19
-
20
-
21
-
22
-
23
-
24
-
25
-
26
-
27
-
28
-
29
-
30
-
31
-
32
-
33
-
34
-
35
-
36
-
37
-
38
-
39
-
40
-
41
-
42
-
43
-
44
-
45
-
46
-
47
-
48
-
49
-
50
-
51
-
52
-
53
-
54
-
55
-
56
-
57
-
58
-
59
-
60
-
61
-
62
-
63
-
64
-
65
-
66
-
67
-
68
-
69
-
70
-
71
-
72
-
73
-
74
-
 75
75 -
 76
76 -
 77
77 -
 78
78 -
 79
79 -
 80
80 -
 81
81 -
 82
82 -
 83
83 -
 84
84 -
 85
85 -
 86
86 -
 87
87 -
 88
88 -
 89
89 -
 90
90 -
 91
91 -
 92
92 -
 93
93 -
 94
94 -
 95
95 -
96
-
97
-
98
-
99
-
100
-
101
-
102
-
103
-
104
-
105
-
106
-
107
-
108
-
109
-
110
-
111
-
112
-
113
-
114
-
115
-
116
-
117
-
118
-
119
-
120
-
121
-
122
-
123
-
124
-
125
-
126
-
127
-
128
-
129
-
130
-
131
-
132
-
133
-
134
-
135
-
136
-
137
-
138
-
139
-
140
-
141
-
142
-
143
-
144
-
145
-
146
-
147
-
148
-
149
-
150
-
151
-
152
-
153
-
154
-
155
-
156
-
157
-
158
-
159
-
160
-
161
-
162
-
163
-
164
-
165
-
166
-
167
-
168
-
169
-
170
-
171
-
172
-
173
-
174
-
175
-
176
-
177
-
178
-
179
-
180
-
181
-
182
-
183
-
184
-
185
-
186
-
187
-
188
-
189
-
190
-
191
-
192
-
193
-
194
-
195
-
196
-
197
-
198
-
199
-
200
-
201
-
202
-
203
-
204
 |
 |

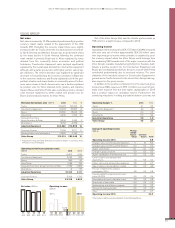
During 2015 net financial debt, excluding
provisions for post-employment benefits in
Industrial Operations, decreased by SEK 10.3
billion, resulting in a net financial asset posi-
tion of SEK 0.3 billion on December 31, 2015.
This was equal to 0.5% of shareholders’ equity.
Including provisions for post- employment benefits, the Industrial
Operations net financial debt amounted to SEK 13.2 billion which
was equal to 17.6% of shareholders’ equity. The decrease was
mainly explained by a positive operating cash-flow of SEK 18,3
billion, the disposal of shares in the listed Indian company Eicher
Motors Limited, remeasurements of the defined benefit pension
obligation by SEK 3.5 billion offset by the acquisition of 45% of
Dongfeng Commercial Vehicles by SEK 7.0 billion and dividend
paid to the AB Volvo shareholders by SEK 6.1 billion. The decrease
of the defined benefit pension obligations was an effect of an
increase in the discount rate, mainly in Sweden.
Read more in Note 5 regarding Volvo Group’s investments in joint
ventures, associated companies and other shares and participations.
Read more in Note 20 Provisions for post- employment benefits.
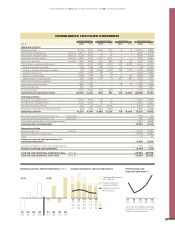
The Volvo Group’s liquid funds, i.e. cash and cash equivalents
and marketable securities combined amounted to SEK 24.4 bil-
lion at December 31, 2015. In addition to this granted but unuti-
lized credit facilities amounted to SEK 39.7 billion. Cash and cash
equivalents as of December 31, 2015 include SEK 0.8 (0.2) billion
that is not available to use by the Volvo Group and SEK 5.4 (6.1)
billion where other limitations exists.
Read more in Note 18 Marketable securities and liquid funds.
Read more in Note 22 Liabilities regarding the maturity structure on
Volvo Group’s credit facilities.
Total assets in the Volvo Group amounted to SEK 374.2 billion
as of December 31, 2015, a decrease of SEK 8.7 billion since
December 31, 2014. Negative currency effects from revaluation
of foreign subsidiaries by SEK 5.2 billion have decreased total
assets offset by increased customer-financing receivables due to
portfolio growth in the Customer Finance Operations. During the
year the Volvo Groups financial assets have been impacted by the
disposal of shares in the listed Indian company Eicher Motors lim-
ited and by the acquisition of 45% of shares in Dongfeng Com-
mercial Vehicles Co., Ltd.
Read more in Note 5 regarding Volvo Group’s investments in joint
ventures, associated companies and other shares and participations.
The Group’s intangible assets amounted to SEK 36.4 billion as
of December 31, 2015. Investments in research and development
amounted to SEK 2.3 billion (1.4), resulting in a net value of capi-
talized development costs of SEK 11.7 billion at the end of the
year. Compared to prior year, capitalization increased while the
amortization correspond to 2014 years level. The Volvo Group’s
total goodwill amounted to SEK 22.1 billion as of December 31,
2015, an increase by SEK 0.6 billion compared to year-end 2014.
The goodwill is tested for impairment on an annual basis.
Read more in Note 12 Intangible assets regarding the impairment
test on goodwill.
Tangible assets decreased by SEK 0.3 billion during 2015.
The value of inventories decreased by SEK 1.1 billion during
2015. The decrease is mainly related to finished products within
Trucks and Construction Equipment.
As of December 31, 2015 assets amounting to SEK 3,314 M
and liabilities amounting to SEK 573 M are classified as assets
held for sale. This mainly pertains to the planned divestment of
the North American used truck business, Arrow Truck Sales. The
assets and liabilities held for sale also includes the planned
divestment of the external IT business and outsourcing of Volvo
Group’s own IT infrastructure planned to be divested as of March
31, 2016.
Read more in Note 3 regarding assets and liabilities held for sale.
The net value of assets and liabilities related to pensions and
similar obligations amounted to SEK 13.6 billion as of Decem-
ber 31, 2015, a decrease of SEK 3.0 billion compared to year-end
2014. In 2015 the Volvo Group recognized a positive remeasure-
ment effect impacting the pension obligation amounting to SEK
3.5 billion, mainly driven by higher discount rates in Sweden and
to less extent by review of all pension assumptions for the Swed-
ish plan. On the asset side a negative remeasurement effect
amounting to SEK 0.2 billion was recognized. In total the remeas-
urement amounted to SEK 3.3 billion whereof positive SEK 3.5
billion was recognized through other comprehensive income and
negative SEK 0.2 billion through the income statement since per-
taining to post-employment benefit other than pension.
Read more in Note 20 Provisions for post- employment benefits.
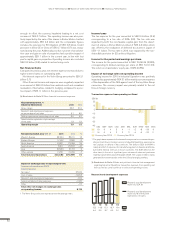
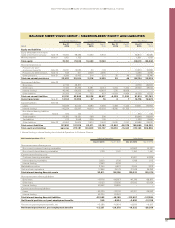
As of December 31, 2015 the shareholders’ equity for the
Volvo Group amounted to SEK 85.6 billion compared to SEK 80.0
billion at year-end 2014. The equity ratio was 22.9% compared to
20.9% on December 31, 2014. At the same date the equity ratio
in the Industrial operations amounted to 28.6% (25.7).
Net financial debt in the Volvo Group’s Industrial Operations decreased by SEK 13.1 billion during 2015 and equals to
17.6% of shareholders’ equity at December 31.
STRENGTHENED FINANCIAL
POSITION
GROUP PERFORMANCE BOARD OF DIRECTORS’ REPORT 2015
FINANCIAL POSITION
83