Volvo 2015 Annual Report Download - page 86
Download and view the complete annual report
Please find page 86 of the 2015 Volvo annual report below. You can navigate through the pages in the report by either clicking on the pages listed below, or by using the keyword search tool below to find specific information within the annual report.-
 1
1 -
2
-
3
-
4
-
5
-
6
-
7
-
8
-
9
-
10
-
11
-
12
-
13
-
14
-
15
-
16
-
17
-
18
-
19
-
20
-
21
-
22
-
23
-
24
-
25
-
26
-
27
-
28
-
29
-
30
-
31
-
32
-
33
-
34
-
35
-
36
-
37
-
38
-
39
-
40
-
41
-
42
-
43
-
44
-
45
-
46
-
47
-
48
-
49
-
50
-
51
-
52
-
53
-
54
-
55
-
56
-
57
-
58
-
59
-
60
-
61
-
62
-
63
-
64
-
65
-
66
-
67
-
68
-
69
-
70
-
71
-
72
-
73
-
74
-
75
-
 76
76 -
 77
77 -
 78
78 -
 79
79 -
 80
80 -
 81
81 -
 82
82 -
 83
83 -
 84
84 -
 85
85 -
 86
86 -
 87
87 -
 88
88 -
 89
89 -
 90
90 -
 91
91 -
 92
92 -
 93
93 -
 94
94 -
 95
95 -
 96
96 -
97
-
98
-
99
-
100
-
101
-
102
-
103
-
104
-
105
-
106
-
107
-
108
-
109
-
110
-
111
-
112
-
113
-
114
-
115
-
116
-
117
-
118
-
119
-
120
-
121
-
122
-
123
-
124
-
125
-
126
-
127
-
128
-
129
-
130
-
131
-
132
-
133
-
134
-
135
-
136
-
137
-
138
-
139
-
140
-
141
-
142
-
143
-
144
-
145
-
146
-
147
-
148
-
149
-
150
-
151
-
152
-
153
-
154
-
155
-
156
-
157
-
158
-
159
-
160
-
161
-
162
-
163
-
164
-
165
-
166
-
167
-
168
-
169
-
170
-
171
-
172
-
173
-
174
-
175
-
176
-
177
-
178
-
179
-
180
-
181
-
182
-
183
-
184
-
185
-
186
-
187
-
188
-
189
-
190
-
191
-
192
-
193
-
194
-
195
-
196
-
197
-
198
-
199
-
200
-
201
-
202
-
203
-
204
 |
 |

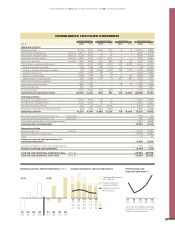
GROUP PERFORMANCE BOARD OF DIRECTORS’ REPORT 2015 FINANCIAL POSITION
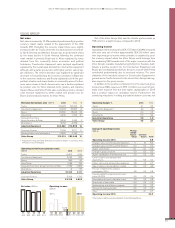
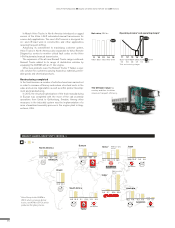
Net financial position, Industrial Operations, SEK bn
2014 2015
Q4
–13.2
Q3
–29.8
Q2
–26.1
Q1
–37.4
Q4
–26.4
Q3
–37.4
Q2
–37.8
Q1
–34.5
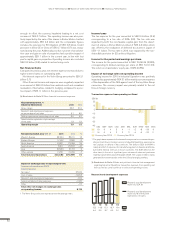
Change in net financial position,
Industrial Operations, SEK bn 2015 2014
Net financial position at
beginning of period –26.4 –32.1
Cash flow from operating activities 26.7 14.3
Investments in fixed assets –9.1 –9.1
Disposals 0.7 1.1
Operating cash flow 18.3 6.4
Investments and divestments of shares, net –2.0 0.1
Acquired and divested operations, net 0.4 7.7
Capital injections to/from Customer Finance
Operations 0.1 0.7
Currency effect 0.4 –0.5
Dividend paidto AB Volvo shareholders –6.1 –6.1
Remeasurements of defined benefit
pension plans 3.5 –3.6
Pension payments and costs, net –0.6 0.7
Other changes –0.9 0.2
Total change 13.1 5.7
Net financial position at end of period –13.2 –26.4
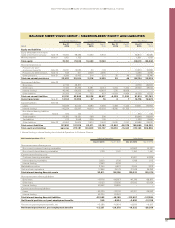
BALANCE SHEET VOLVO GROUP – ASSETS
Industrial Operations Customer Finance Eliminations Volvo Group
SEK M
Dec 31
2015
Dec 31
2014
Dec 31
2015
Dec 31
2014
Dec 31
2015
Dec 31
2014
Dec 31
2015
Dec 31
2014
Assets
Non-current assets
Intangible assets Note 12 36,314 37,010 102 105 – – 36,416 37,115
Tangible assets Note 13
Property, plant and equipment 53,271 54,821 64 94 – – 53,335 54,915
Investment property 283 266 – – – – 283 266
Assets under operating leases 20,616 19,484 18,253 17,872 –6,338 –6,138 32,531 31,218
Financial assets
Investments in joint ventures
and associated companies Note 5 11,148 4,821 – – – – 11,148 4,821
Other shares and participations Note 5 893 5,004 8 13 – – 902 5,017
Non-current customer
financing receivables Note 15 3 1,205 52,163 51,380 –1,204 –1,254 50,962 51,331
Prepaid pensions Note 20 34 126 – – – – 34 126
Non-current interest-bearing
receivables Note 16 1,138 1,041 500 22 –487 378 1,150 1,441
Other non-current receivables Note 16 3,271 3,528 140 150 –143 –165 3,268 3,513
Deferred tax assets Note 10 12,582 15,022 868 809 – – 13,450 15,831
Total non-current assets 139,552 142,328 72,098 70,445 –8,172 –7,179 203,478 205,594
Current assets
Inventories Note 17 44,194 45,364 196 169 – – 44,390 45,533
Current receivables
Customer-financing
receivables Note 15 9 623 52,404 48,063 –792 –850 51,621 47,836
Tax assets 1,537 2,918 624 496 – – 2,161 3,414
Interest-bearing receivables Note 16 2,600 1,736 14 345 –827 –968 1,788 1,113
Internal funding1 7,963 4,374 – – –7,963 –4,374 – –
Accounts receivable Note 16 28,577 30,495 525 400 – – 29,101 30,895
Other receivables Note 16 14,259 13,950 1,327 1,984 –1,667 –1,265 13,920 14,669
Non interest-bearing assets
held for sale Note 3 3,314 288 – – – – 3,314 288
Interest-bearing assets
held for sale Note 3––––––––
Marketable securities Note 18 3,344 6,927 – 385 – – 3,344 7,312
Cash and cash equivalents Note 18 17,866 24,178 3,651 2,470 –469 –406 21,048 26,242
Total current assets 123,664 130,853 58,741 54,312 –11,717 –7,863 170,687 177,302
Total assets 263,216 273,181 130,839 124,757 –19,890 –15,042 374,165 382,896
1 Internal funding is internal lending from Industrial Operations to Customer Finance.
84