Volvo 2015 Annual Report Download - page 25
Download and view the complete annual report
Please find page 25 of the 2015 Volvo annual report below. You can navigate through the pages in the report by either clicking on the pages listed below, or by using the keyword search tool below to find specific information within the annual report.-
 1
1 -
2
-
3
-
4
-
5
-
6
-
7
-
8
-
9
-
10
-
11
-
12
-
13
-
14
-
 15
15 -
 16
16 -
 17
17 -
 18
18 -
 19
19 -
 20
20 -
 21
21 -
 22
22 -
 23
23 -
 24
24 -
 25
25 -
 26
26 -
 27
27 -
 28
28 -
 29
29 -
 30
30 -
 31
31 -
 32
32 -
 33
33 -
 34
34 -
 35
35 -
36
-
37
-
38
-
39
-
40
-
41
-
42
-
43
-
44
-
45
-
46
-
47
-
48
-
49
-
50
-
51
-
52
-
53
-
54
-
55
-
56
-
57
-
58
-
59
-
60
-
61
-
62
-
63
-
64
-
65
-
66
-
67
-
68
-
69
-
70
-
71
-
72
-
73
-
74
-
75
-
76
-
77
-
78
-
79
-
80
-
81
-
82
-
83
-
84
-
85
-
86
-
87
-
88
-
89
-
90
-
91
-
92
-
93
-
94
-
95
-
96
-
97
-
98
-
99
-
100
-
101
-
102
-
103
-
104
-
105
-
106
-
107
-
108
-
109
-
110
-
111
-
112
-
113
-
114
-
115
-
116
-
117
-
118
-
119
-
120
-
121
-
122
-
123
-
124
-
125
-
126
-
127
-
128
-
129
-
130
-
131
-
132
-
133
-
134
-
135
-
136
-
137
-
138
-
139
-
140
-
141
-
142
-
143
-
144
-
145
-
146
-
147
-
148
-
149
-
150
-
151
-
152
-
153
-
154
-
155
-
156
-
157
-
158
-
159
-
160
-
161
-
162
-
163
-
164
-
165
-
166
-
167
-
168
-
169
-
170
-
171
-
172
-
173
-
174
-
175
-
176
-
177
-
178
-
179
-
180
-
181
-
182
-
183
-
184
-
185
-
186
-
187
-
188
-
189
-
190
-
191
-
192
-
193
-
194
-
195
-
196
-
197
-
198
-
199
-
200
-
201
-
202
-
203
-
204
 |
 |

;
2012 Reorganization, brand
positioning and new strategy
;
2013 Extensive product renewal
and launch of efficiency program
;
2014 Execute efficiency program
and drive organic growth
;
2015 Deliver profitability
improvement
A GLOBAL GROUP STRATEGY
1999–2011
ACQUISITION-DRIVEN
GROWTH
2012–2015
TRANSFORMATION
2016–>
INCREASED
PROFITABILITY
Three phases in the Volvo Group’s development
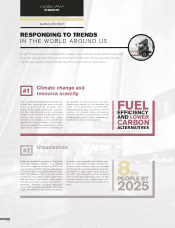
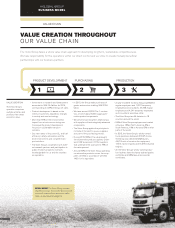
The Volvo Group creates customer value by delivering products
and services that meet our customers’ priorities and challenges.
We provide products and services that are tailored to meet our
customers’ needs and improve their profitability. This is delivered
through a retail network focused on building customer satisfac-
tion. As of March 1, 2016 the truck business will be organized
based on the brands in order to increase customer focus and to
drive the business with higher speed and efficiency.
CREATING VALUE FOR OUR CUSTOMERS
During the period of 2012–2015 the Volvo Group underwent a
transformation program aimed at reorganizing the company to
take out overlaps, reduce structural costs and increase efficiency
and profitability after the period of acquisition-driven growth.
Among the activities in the program to reduce the Group’s
structural cost levels, which were launched at the end of 2013
and implemented in 2014 and 2015, there were substantial
reductions of white- collar employees and consultants, a reduc-
tion in research and development expenses, optimization of the
sales and service channel and the industrial footprint for trucks as
well as a consolidation and optimization of the spare parts distri-
bution worldwide.
In the autumn of 2014 additional opportunities to reduce costs
were identified and therefore the scope of the program was
increased with the reorganization of Group Trucks Sales in order
to increase efficiency and reduce costs; further cost-reduction
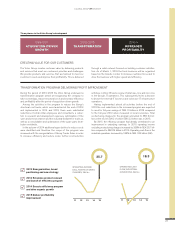
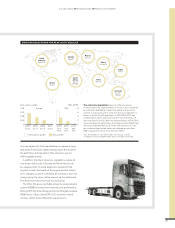
TRANSFORMATION PROGRAM DELIVERING PROFIT IMPROVEMENT
activities in Volvo CE and a review of what was core and non-core
in the Group’s IT operations. This subsequently led to a decision
to divest the external IT business and outsource IT infrastructure
operations.
Having implemented almost all activities before the end of
2015 the cost reductions in the increased program are expected
to result in full-year savings of SEK 10 billion in 2016 compared
to the full year 2012 when measured in local currencies. Total
restructuring charges for the program amounted to SEK 6.2 bil-
lion at the end of 2015, of which SEK 2.3 billion was in 2015.
By 2015 the efficiency program had already contributed to an
improvement in underlying earnings. In 2015 operating income
excluding restructuring charges increased by 206% to SEK 25.7 bil-
lion compared to SEK 8.4 billion in 2014. Operating cash flow in the
industrial operations increased by 186% to SEK 18.3 billion (6.4).
OPERATING INCOME
EXCL. RESTRUCTURING
CHARGES, SEK bn
11 13 14 1512
25.7
OPERATING CASH
FLOW, INDUSTRIAL
OPERATIONS, SEK bn
14 15131211
18.3
23