Volvo 2015 Annual Report Download - page 165
Download and view the complete annual report
Please find page 165 of the 2015 Volvo annual report below. You can navigate through the pages in the report by either clicking on the pages listed below, or by using the keyword search tool below to find specific information within the annual report.-
 1
1 -
2
-
3
-
4
-
5
-
6
-
7
-
8
-
9
-
10
-
11
-
12
-
13
-
14
-
15
-
16
-
17
-
18
-
19
-
20
-
21
-
22
-
23
-
24
-
25
-
26
-
27
-
28
-
29
-
30
-
31
-
32
-
33
-
34
-
35
-
36
-
37
-
38
-
39
-
40
-
41
-
42
-
43
-
44
-
45
-
46
-
47
-
48
-
49
-
50
-
51
-
52
-
53
-
54
-
55
-
56
-
57
-
58
-
59
-
60
-
61
-
62
-
63
-
64
-
65
-
66
-
67
-
68
-
69
-
70
-
71
-
72
-
73
-
74
-
75
-
76
-
77
-
78
-
79
-
80
-
81
-
82
-
83
-
84
-
85
-
86
-
87
-
88
-
89
-
90
-
91
-
92
-
93
-
94
-
95
-
96
-
97
-
98
-
99
-
100
-
101
-
102
-
103
-
104
-
105
-
106
-
107
-
108
-
109
-
110
-
111
-
112
-
113
-
114
-
115
-
116
-
117
-
118
-
119
-
120
-
121
-
122
-
123
-
124
-
125
-
126
-
127
-
128
-
129
-
130
-
131
-
132
-
133
-
134
-
135
-
136
-
137
-
138
-
139
-
140
-
141
-
142
-
143
-
144
-
145
-
146
-
147
-
148
-
149
-
150
-
151
-
152
-
153
-
154
-
 155
155 -
 156
156 -
 157
157 -
 158
158 -
 159
159 -
 160
160 -
 161
161 -
 162
162 -
 163
163 -
 164
164 -
 165
165 -
 166
166 -
 167
167 -
 168
168 -
 169
169 -
 170
170 -
 171
171 -
 172
172 -
 173
173 -
 174
174 -
 175
175 -
176
-
177
-
178
-
179
-
180
-
181
-
182
-
183
-
184
-
185
-
186
-
187
-
188
-
189
-
190
-
191
-
192
-
193
-
194
-
195
-
196
-
197
-
198
-
199
-
200
-
201
-
202
-
203
-
204
 |
 |

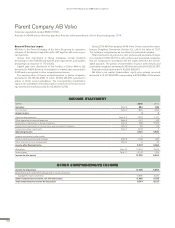
INCOME FROM INVESTMENTS
IN GROUP COMPANIES
NOTE 5
Income from investments in
Group Companies 2015 2014
Dividends received
Volvo Financial Services AB 565 450
Volvo Automotive Finance (China) 477 –
Volvo Malaysia Sdn Bhd. 19 –
Volvo China Investment Co. Ltd. – 367
Volvo Danmark AS – 61
Volvo East Asia (Pte) Ltd. – 108
Volvo Holding Sverige AB – 4,500
Volvo Korea Holding AB – 1,300
Volvo Event Management UK Ltd. – 1
Volvo Norge AS – 39
Subtotal 1,061 6,826
Impairment of shares
Volvo Logistics AB –85 –
Volvo Business Services AB –67 –
Volvo East Asia (Pte) Ltd. –9 –
Alviva AB –5 –
Volvo Group UK Ltd. – –134
Subtotal –166 –134
Reversal impairment of shares
Volvo Danmark AS 30 –
Subtotal 30 –
Income from divestment of shares
Part of Volvo Norge AS after fission 134 –
Adjustment of divestment Volvo Aero AB 4 –
Subtotal 138 –
Income from investments in Group Companies 1,063 6,692
Transfer price adjustments and royalties amount to an expense of 775 (1,120).
Dividend of 35 (28) was received from VE Commercial Vehicles Ltd, and
of 20 (19) from Deutz AG. Income include reversal of impairment of par-
ticipation in Blue Chip Jet HB with 4 and in Blue Chip Jet II HB with 25.
Income 2014 included impairment of Blue Chip Jet II HB with 21.
INCOME FROM INVESTMENTS IN JOINT
VENTURES AND ASSOCIATED COMPANIES
NOTE 6
Income from other investments includes gain from divestment of the hold-
ing in Eicher Motors Ltd. of 4,608. Dividend of 7 (7) was received from
Eicher Motors Ltd. Impairment of the shares in Johanneberg Science
Park AB and Lindholmen Science Park AB is included by an expense of 3
(–).
INCOME FROM OTHER INVESTMENTS
NOTE 7
Interest expenses and similar charges totalling 1,195 (947) included inter-
est of 1,193 (944) to subsidiaries.
INTEREST EXPENSES
NOTE 8
Other financial income and expenses include exchange rate gains and
losses, costs for credit rating and costs for stock exchange listing.
OTHER FINANCIAL INCOME
AND EXPENSES
NOTE 9
Group contributions amounted to a net of 12,565 (3,504).
ALLOCATIONS
NOTE 10
Income taxes were distributed as follow:
2015 2014
Current taxes relating to the period –69 –20
Deferred taxes –2,034 –359
I/S Total income taxes –2,103 –379
Deferred taxes relate to estimated tax on the change in tax-loss carry-
forwards and temporary differences. Deferred tax assets are recognized
to the extent that it is probable that the amount can be utilized against
future taxable income. The tax-loss carry forwards have indefinite period
of utilization.
Deferred taxes related to change in tax-loss carryforwards amount to
an expense of 2,037 (357) and to changes in other temporary differences
to an income of 3 (expense of 2).
The table below discloses the principal reasons for the difference
between the corporate income tax of 22% and the tax for the period.
2015 2014
Income before taxes 14,842 7,069
Income tax according to applicable tax rate –3,265 –1,555
Capital gains/losses 1,044 –
Non-taxable dividends 247 1,513
Non-taxable revaluations of shareholdings –24 –34
Other non-deductible expenses –26 –23
Other non-taxable income 0 10
Withholding tax –24 –20
Adjustment of deferred taxes for prior periods –55 –269
Recognition and derecognition of deferred tax
assetsdue to change in tax rate – –1
Income taxes for the period –2,103 –379
Specification of deferred tax assets Dec 31,
2015 Dec 31,
2014
Deferred tax-loss carryforwards – 2,037
Provisions for post-employmentbenefits 154 150
Provisions for restructuring measures 3 4
B/S Deferred tax assets 157 2,191
NOTE 11 INCOME TAXES
163
GROUP PERFORMANCE 2015 PARENT COMPANY NOTES