Volvo 2015 Annual Report Download - page 120
Download and view the complete annual report
Please find page 120 of the 2015 Volvo annual report below. You can navigate through the pages in the report by either clicking on the pages listed below, or by using the keyword search tool below to find specific information within the annual report.-
 1
1 -
2
-
3
-
4
-
5
-
6
-
7
-
8
-
9
-
10
-
11
-
12
-
13
-
14
-
15
-
16
-
17
-
18
-
19
-
20
-
21
-
22
-
23
-
24
-
25
-
26
-
27
-
28
-
29
-
30
-
31
-
32
-
33
-
34
-
35
-
36
-
37
-
38
-
39
-
40
-
41
-
42
-
43
-
44
-
45
-
46
-
47
-
48
-
49
-
50
-
51
-
52
-
53
-
54
-
55
-
56
-
57
-
58
-
59
-
60
-
61
-
62
-
63
-
64
-
65
-
66
-
67
-
68
-
69
-
70
-
71
-
72
-
73
-
74
-
75
-
76
-
77
-
78
-
79
-
80
-
81
-
82
-
83
-
84
-
85
-
86
-
87
-
88
-
89
-
90
-
91
-
92
-
93
-
94
-
95
-
96
-
97
-
98
-
99
-
100
-
101
-
102
-
103
-
104
-
105
-
106
-
107
-
108
-
109
-
 110
110 -
 111
111 -
 112
112 -
 113
113 -
 114
114 -
 115
115 -
 116
116 -
 117
117 -
 118
118 -
 119
119 -
 120
120 -
 121
121 -
 122
122 -
 123
123 -
 124
124 -
 125
125 -
 126
126 -
 127
127 -
 128
128 -
 129
129 -
 130
130 -
131
-
132
-
133
-
134
-
135
-
136
-
137
-
138
-
139
-
140
-
141
-
142
-
143
-
144
-
145
-
146
-
147
-
148
-
149
-
150
-
151
-
152
-
153
-
154
-
155
-
156
-
157
-
158
-
159
-
160
-
161
-
162
-
163
-
164
-
165
-
166
-
167
-
168
-
169
-
170
-
171
-
172
-
173
-
174
-
175
-
176
-
177
-
178
-
179
-
180
-
181
-
182
-
183
-
184
-
185
-
186
-
187
-
188
-
189
-
190
-
191
-
192
-
193
-
194
-
195
-
196
-
197
-
198
-
199
-
200
-
201
-
202
-
203
-
204
 |
 |
4:3
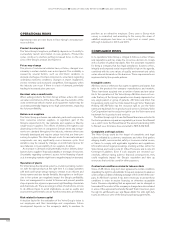
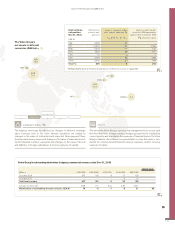
Commercial currency exposure
Transaction exposure from commercial flows
The Volvo Group conducts manufacturing in 18 countries around the
globe and more than 90% of net sales are generated in countries other
than Sweden. Transaction exposure from commercial flows in foreign
currency is generated from internal purchases and sales between manu-
facturing units and market companies and external sales and purchases
in foreign currency around the globe. As the predominant parts of the
operations in the Volvo Group are situated outside Sweden, the fluctua-
tions in currency rates affecting the transaction flows in foreign currency
are in many cases not against SEK. Industrial Operations transaction
exposure in key currencies is presented in table 4:5. The graph repre-
sents the transaction exposure from commercial operating net cash flows
in foreign currency, expressed as net surpluses or deficits in key curren-
cies. The deficit in SEK and KRW is mainly an effect of expenses for
manufacturing plants in Sweden and Korea, but limited external revenues
in those currencies. The EUR deficit on the other hand, is the net of sig-
nificant gross volumes of sales and purchases made by many entities
around the globe in EUR. The surplus in USD is mainly generated from
external sales to entities within the US and emerging markets.
The hedging of the Volvo Group’s commercial currency exposure is
decided centrally. The Volvo Group’s consolidated currency portfolio
exposure is the value of forecasted flows in foreign currency. The Volvo
Group only hedge the part of the forecasted portfolio that is considered
highly probable to occur, i.e. firm flows, where the main parts will be real-
ized within six months. The Volvo Group uses forward contracts and cur-
rency options to hedge the portion of the value of forecasted future pay-
ment flows in foreign currency. The hedged amount of firm flows for all
periods fall within the framework of the Volvo Group’s currency policy. The
table 4:2 shows outstanding forward and option contracts for the hedg-
ing of commercial currency risks.
Translation exposure from the consolidation of operating income in
foreign subsidiaries
In conjunction with the translation of operating income in foreign subsidiaries,
the Volvo Group’s earnings are impacted if currency rates change. The Volvo
Group does not hedge this risk. The table 4:7 shows the translation effect
when consolidating operating income for 2015 in foreign subsidiaries in
key currencies for Industrial Operations.
Read more in section currency exposure of equity below regarding currency
hedging of equity.
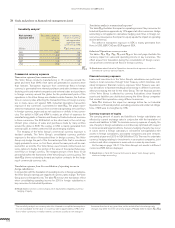
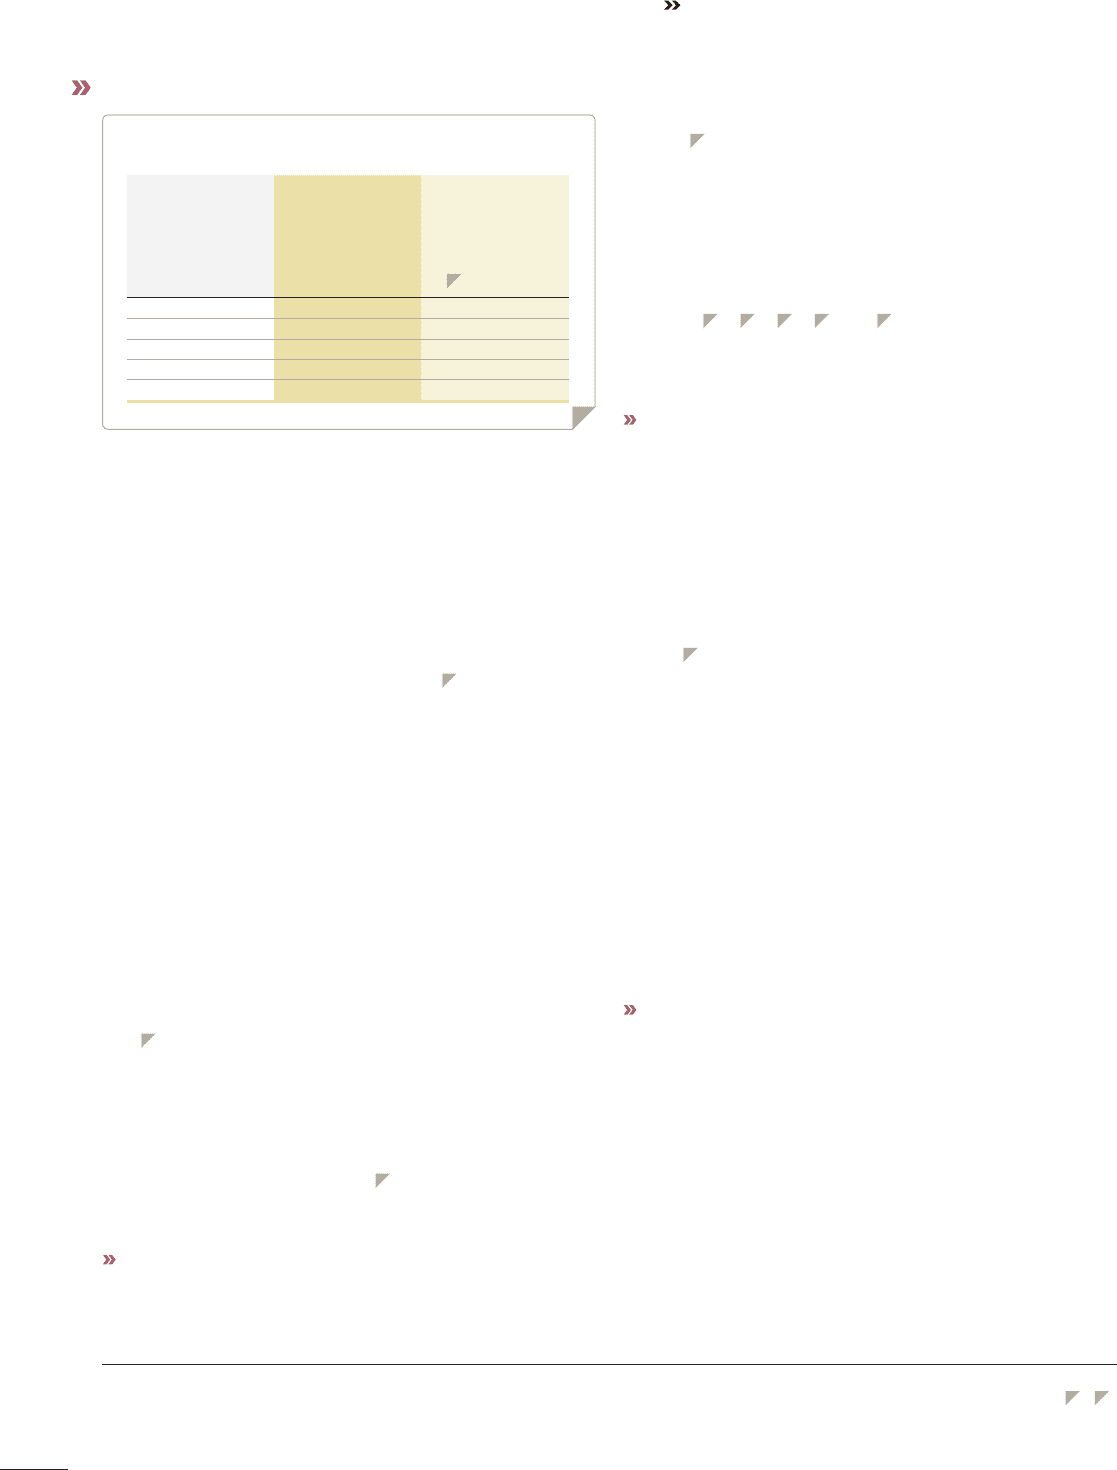
Sensitivity analysis- transactional exposure*
The table 4:3 illustrates the impact on operating income if key currencies for
Industrial Operations appreciate by 10% against all other currencies. Hedge
accounting is not applied on derivatives hedging cash flows in foreign cur-
rency. As a consequence the impact on equity equals the impact on operating
income before tax.
The deficit in transaction exposure in SEK is mainly generated from
flows in USD, GBP, CAD and EUR against SEK.
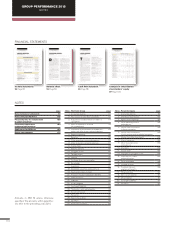
Industrial Operations currency review
The tables 4:4 4:5 4:6 4:7 and 4:8 on the next page illustrate the
currency impact on sales and operating income in key currencies. The
effect arises from translation during the consolidation of foreign curren-
cies and from commercial net flows in foreign currency.
Read more about Industrial Operations transactional exposure in section
Commercial currency exposure above.
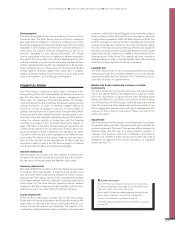
Financial currency exposure
Loans and investments in the Volvo Group’s subsidiaries are performed
mainly in local currencies through Volvo Treasury, which minimizes indi-
vidual companies’ financial currency exposure. Volvo Treasury uses vari-
ous derivatives to facilitate lending and borrowing in different currencies
without increasing the risk for the Volvo Group. The net financial position
of the Volvo Group is affected by currency fluctuations since financial
assets and liabilities are distributed among the Volvo Group companies
that conduct their operations using different currencies.
Table 4:1 discloses the impact on earnings before tax on Industrial
Operations net financial position, excluding pensions and similar net obliga-
tions, if SEK were to strengthen by 10%.
Currency exposure of equity
The carrying amount of assets and liabilities in foreign subsidiaries are
affected by current exchange rates in conjunction with the translation of
assets and liabilities to SEK. To minimize currency exposure of equity, the
size of equity in foreign subsidiaries is continuously optimized with respect
to commercial and legal conditions. Currency hedging of equity may occur
in cases where a foreign subsidiary is considered overcapitalized. Net
assets in foreign subsidiaries, associated companies and joint ventures
amounted at year-end 2015 to SEK 68 billion (70). The need to undertake
currency hedging relating to investments in associated companies, joint
ventures and other companies is assessed on a case-by-case basis.
On the map on page 116–117 the Volvo Group’s net assets in different
currencies (SEK bn) are displayed.
Read more in Note 30 Financial Instruments about Volvo Group’s policy
choice on hedge accounting.
Goals and policies in financial risk management (cont.)
* The sensitivity analysis on currency rate risks is based on simplified assumptions.
It is not improbable for the value in a currency rate to appreciate by 10% in rela-
tion to other currencies. In reality however, currencies usually do not change in
the same direction at any given time, so the actual effect of exchange-rate
changes may differ from the sensitivity analysis. Please refer to tables 4:1 4:3
Risk currency
exposure 2015
Transaction exposure
from operating
net flows
Impact on operating
income if currency
rate appreciates
against all other
currencies by 10%
B (Currency risks) SEK bn
SEK –39.1 -3.9
KRW –8.0 –0.8
EUR –2.4 –0.2
GBP 9.3 0.9
USD 18.9 1.9
Sensitivity analysis*
GROUP PERFORMANCE 2015 NOTES
118