Volvo 2015 Annual Report Download - page 87
Download and view the complete annual report
Please find page 87 of the 2015 Volvo annual report below. You can navigate through the pages in the report by either clicking on the pages listed below, or by using the keyword search tool below to find specific information within the annual report.-
 1
1 -
2
-
3
-
4
-
5
-
6
-
7
-
8
-
9
-
10
-
11
-
12
-
13
-
14
-
15
-
16
-
17
-
18
-
19
-
20
-
21
-
22
-
23
-
24
-
25
-
26
-
27
-
28
-
29
-
30
-
31
-
32
-
33
-
34
-
35
-
36
-
37
-
38
-
39
-
40
-
41
-
42
-
43
-
44
-
45
-
46
-
47
-
48
-
49
-
50
-
51
-
52
-
53
-
54
-
55
-
56
-
57
-
58
-
59
-
60
-
61
-
62
-
63
-
64
-
65
-
66
-
67
-
68
-
69
-
70
-
71
-
72
-
73
-
74
-
75
-
76
-
 77
77 -
 78
78 -
 79
79 -
 80
80 -
 81
81 -
 82
82 -
 83
83 -
 84
84 -
 85
85 -
 86
86 -
 87
87 -
 88
88 -
 89
89 -
 90
90 -
 91
91 -
 92
92 -
 93
93 -
 94
94 -
 95
95 -
 96
96 -
 97
97 -
98
-
99
-
100
-
101
-
102
-
103
-
104
-
105
-
106
-
107
-
108
-
109
-
110
-
111
-
112
-
113
-
114
-
115
-
116
-
117
-
118
-
119
-
120
-
121
-
122
-
123
-
124
-
125
-
126
-
127
-
128
-
129
-
130
-
131
-
132
-
133
-
134
-
135
-
136
-
137
-
138
-
139
-
140
-
141
-
142
-
143
-
144
-
145
-
146
-
147
-
148
-
149
-
150
-
151
-
152
-
153
-
154
-
155
-
156
-
157
-
158
-
159
-
160
-
161
-
162
-
163
-
164
-
165
-
166
-
167
-
168
-
169
-
170
-
171
-
172
-
173
-
174
-
175
-
176
-
177
-
178
-
179
-
180
-
181
-
182
-
183
-
184
-
185
-
186
-
187
-
188
-
189
-
190
-
191
-
192
-
193
-
194
-
195
-
196
-
197
-
198
-
199
-
200
-
201
-
202
-
203
-
204
 |
 |

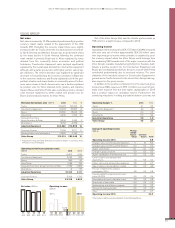
GROUP PERFORMANCE BOARD OF DIRECTORS’ REPORT 2015 FINANCIAL POSITION
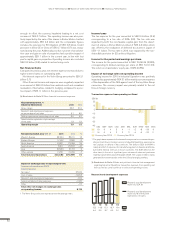
Net financial position, SEK M Industrial Operations Volvo Group
Dec 31 2015 Dec 31 2014 Dec 31 2015 Dec 31 2014
Non-current interest-bearing assets
Non-current customer-financing receivables – – 50,962 51,331
Non-current interest-bearing receivables 1,138 1,041 1,150 1,441
Current interest-bearing assets
Customer-financing receivables – – 51,621 47,836
Interest-bearing receivables 2,600 1,736 1,788 1,113
Internal funding 7,963 4,374 – –
Marketable securities 3,344 6,927 3,344 7,312
Cash and cash equivalents 17,866 24,178 21,048 26,242
Total interest-bearing financial assets 32,911 38,256 129,913 135,275
Non-current interest-bearing liabilities
Bond loans –47,776 –68,877 –47,776 –68,877
Other loans –17,123 –27, 395 –27,500 –39,154
Internal funding 42,44259,955––
Current interest-bearing liabilities
Loans –50,339 –32,130 –57,331 –39,953
Internal funding 40,234 20,267 – –
Total interest-bearing financial liabilities –32,562 –48,180 –132,607 –147,984
Net financial position excl. post- employment benefits 349 –9,924 –2,693 –12,709
Provision for post-employment benefits, net –13,586 –16,454 –13,639 –16,557
Net financial position incl. post- employment benefits –13,237 –26,378 –16,332 –29,266
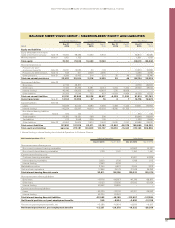
BALANCE SHEET VOLVO GROUP – SHAREHOLDERS’ EQUITY AND LIABILITIES
Industrial Operations Customer Finance Eliminations Volvo Group
SEK M
Dec 31
2015
Dec 31
2014
Dec 31
2015
Dec 31
2014
Dec 31
2015
Dec 31
2014
Dec 31
2015
Dec 31
2014
Equity and liabilities
Equity attributable to the equity
holder of the Parent Company Note 19 73,350 68,382 10,460 9,943 – – 83,810 78,325
Minority interests Note 11 1,801 1,723 – – – – 1,801 1,723
Total equity 75,151 70,105 10,460 9,943 – – 85,610 80,048
Non-current provisions
Provisions for post-
employment benefits Note 20 13,621 16,580 53 103 – – 13,673 16,683
Provisions for deferred taxes Note 10 546 201 2,949 2,595 – – 3,495 2,796
Other provisions Note 21 9,286 12,463 214 231 35 46 9,536 12,740
Total non-current provisions 23,453 29,244 3,216 2,929 35 46 26,704 32,219
Non-current liabilities Note 22
Bond loans 47,776 68,877 – – – – 47,776 68,877
Other loans 17,123 27,395 11,581 13,013 –1,204 –1,254 27,500 39,154
Internal funding1 –42,442 –59,955 42,712 42,997 –270 16,958 – –
Other liabilities 20,359 17,549 733 607 –4,554 –4,424 16,538 13,732
Total non-current liabilities 42,816 53,866 55,026 56,617 –6,028 11,280 91,814 121,763
Current provisions Note 21 14,104 12,390 67 76 6 7 14,176 12,473
Current liabilities Note 22
Loans 50,339 32,130 8,480 9,266 –1,488 –1,443 57,331 39,953
Internal funding1–40,234 –20,267 49,013 42,002 –8,780 –21,735 – –
Non interest-bearing liabilities
held for sale Note 3 573 130 – – – – 573 130
Trade payables 55,250 56,351 398 296 – – 55,648 56,647
Tax liabilities 1,113 2,558 209 135 – – 1,322 2,693
Other liabilities Note 22 40,652 36,674 3,970 3,493 –3,635 –3,197 40,986 36,970
Total current liabilities 107,693 107,576 62,071 55,192 –13,902 –26,375 155,860 136,393
Total equity and liabilities 263,216 273,181 130,839 124,757 –19,890 –15,042 374,165 382,896
1 Internal funding is internal lending from Industrial Operations to Customer Finance.
85