Volvo 2015 Annual Report Download - page 2
Download and view the complete annual report
Please find page 2 of the 2015 Volvo annual report below. You can navigate through the pages in the report by either clicking on the pages listed below, or by using the keyword search tool below to find specific information within the annual report.-
 1
1 -
 2
2 -
 3
3 -
 4
4 -
 5
5 -
 6
6 -
 7
7 -
 8
8 -
 9
9 -
 10
10 -
 11
11 -
 12
12 -
 13
13 -
14
-
15
-
16
-
17
-
18
-
19
-
20
-
21
-
22
-
23
-
24
-
25
-
26
-
27
-
28
-
29
-
30
-
31
-
32
-
33
-
34
-
35
-
36
-
37
-
38
-
39
-
40
-
41
-
42
-
43
-
44
-
45
-
46
-
47
-
48
-
49
-
50
-
51
-
52
-
53
-
54
-
55
-
56
-
57
-
58
-
59
-
60
-
61
-
62
-
63
-
64
-
65
-
66
-
67
-
68
-
69
-
70
-
71
-
72
-
73
-
74
-
75
-
76
-
77
-
78
-
79
-
80
-
81
-
82
-
83
-
84
-
85
-
86
-
87
-
88
-
89
-
90
-
91
-
92
-
93
-
94
-
95
-
96
-
97
-
98
-
99
-
100
-
101
-
102
-
103
-
104
-
105
-
106
-
107
-
108
-
109
-
110
-
111
-
112
-
113
-
114
-
115
-
116
-
117
-
118
-
119
-
120
-
121
-
122
-
123
-
124
-
125
-
126
-
127
-
128
-
129
-
130
-
131
-
132
-
133
-
134
-
135
-
136
-
137
-
138
-
139
-
140
-
141
-
142
-
143
-
144
-
145
-
146
-
147
-
148
-
149
-
150
-
151
-
152
-
153
-
154
-
155
-
156
-
157
-
158
-
159
-
160
-
161
-
162
-
163
-
164
-
165
-
166
-
167
-
168
-
169
-
170
-
171
-
172
-
173
-
174
-
175
-
176
-
177
-
178
-
179
-
180
-
181
-
182
-
183
-
184
-
185
-
186
-
187
-
188
-
189
-
190
-
191
-
192
-
193
-
194
-
195
-
196
-
197
-
198
-
199
-
200
-
201
-
202
-
203
-
204
 |
 |

CO
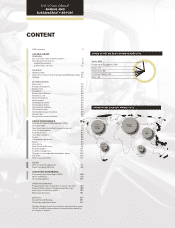
NTENT
SHARE OF NET SALES BY BUSINESS AREA 2015
Trucks, 68%
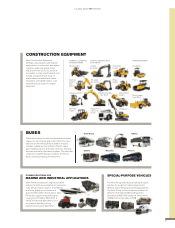
Construction Equipment, 16%
Buses, 7%
Volvo Penta, 3%
Customer Finance, 3%
Other, 3%
SHARE OF NET SALES BY MARKET 2015
North
America
33%
Europe
39%
Asia
17%
6%
South
America
5%
Rest of the
world
CEO comment 2
A GLOBAL GROUP
OVERVIEW
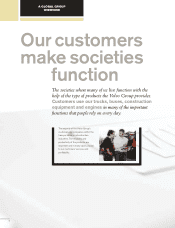
Our customers make societies function 4
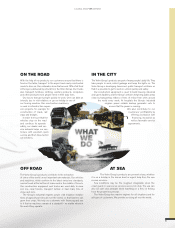
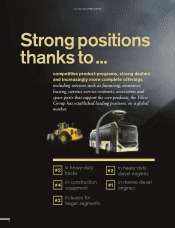
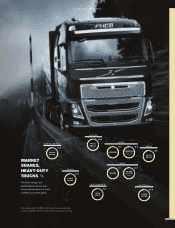
Strong positions thanks to ... 6
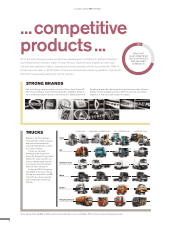
... competitive products ... 8
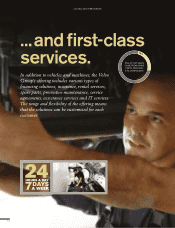
... and first-class services. 10
STRATEGY
Global context 18
Vision, Core values, Code of Conduct and Wanted position 20
Strategy 22
BUSINESS MODEL
Value chain 24
Product development 26
Supply chain 30
Production 32
Distribution & Service 38
Products in use 42
Reuse & Recycling 46
Value creation 50
Sustainability context 52
Sustainability drivers 54
Sustainability ambitions 55
Our material issues 56
Sustainable transport solutions 58
Shared value 64
Responsible business behavior 70
GROUP PERFORMANCE
BOARD OF DIRECTORS’ REPORT 2015
Global strength 76
Significant events published in quarterly reports 78
Financial performance 80
Financial position 83
Cash flow statement 86
Trucks 88
Construction equipment 92
Buses 95
Volvo Penta 97
Volvo Financial Services 99
Financial targets 101
Financial management 102
Changes in consolidated shareholders’ equity 103
The share 104
Risks and uncertainties 107
NOTES
Notes to financial statements 111
Parent Company AB Volvo 158
CORPORATE GOVERNANCE
Corporate Governance Report 2015 168
Board of Directors 178
Group Management 184
OTHER INFORMATION
Proposed policy for remuneration to senior executives 188
Proposed Disposition of Unappropriated Earnings 189
Audit report for AB Volvo (publ) 190
Eleven-year Summary 191
Definitions 200
Annual General Meeting 201
Preliminary publication dates 201
The Volvo Group’s formal financial reports are presented on pages
76–167 and 189 in the printed version and have been audited by
thecompany’s auditors.
THE VOLVO GROUP
ANNUAL AND
SUSTAINABILITY REPORT