ICICI Bank 2011 Annual Report Download - page 96
Download and view the complete annual report
Please find page 96 of the 2011 ICICI Bank annual report below. You can navigate through the pages in the report by either clicking on the pages listed below, or by using the keyword search tool below to find specific information within the annual report.-
 1
1 -
2
-
3
-
4
-
5
-
6
-
7
-
8
-
9
-
10
-
11
-
12
-
13
-
14
-
15
-
16
-
17
-
18
-
19
-
20
-
21
-
22
-
23
-
24
-
25
-
26
-
27
-
28
-
29
-
30
-
31
-
32
-
33
-
34
-
35
-
36
-
37
-
38
-
39
-
40
-
41
-
42
-
43
-
44
-
45
-
46
-
47
-
48
-
49
-
50
-
51
-
52
-
53
-
54
-
55
-
56
-
57
-
58
-
59
-
60
-
61
-
62
-
63
-
64
-
65
-
66
-
67
-
68
-
69
-
70
-
71
-
72
-
73
-
74
-
75
-
76
-
77
-
78
-
79
-
80
-
81
-
82
-
83
-
84
-
85
-
 86
86 -
 87
87 -
 88
88 -
 89
89 -
 90
90 -
 91
91 -
 92
92 -
 93
93 -
 94
94 -
 95
95 -
 96
96 -
 97
97 -
 98
98 -
 99
99 -
 100
100 -
 101
101 -
 102
102 -
 103
103 -
 104
104 -
 105
105 -
 106
106 -
107
-
108
-
109
-
110
-
111
-
112
-
113
-
114
-
115
-
116
-
117
-
118
-
119
-
120
-
121
-
122
-
123
-
124
-
125
-
126
-
127
-
128
-
129
-
130
-
131
-
132
-
133
-
134
-
135
-
136
-
137
-
138
-
139
-
140
-
141
-
142
-
143
-
144
-
145
-
146
-
147
-
148
-
149
-
150
-
151
-
152
-
153
-
154
-
155
-
156
-
157
-
158
-
159
-
160
-
161
-
162
-
163
-
164
-
165
-
166
-
167
-
168
-
169
-
170
-
171
-
172
-
173
-
174
-
175
-
176
-
177
-
178
-
179
-
180
-
181
-
182
-
183
-
184
-
185
-
186
-
187
-
188
-
189
-
190
-
191
-
192
-
193
-
194
-
195
-
196
-
197
-
198
-
199
-
200
-
201
-
202
-
203
-
204
 |
 |

F18
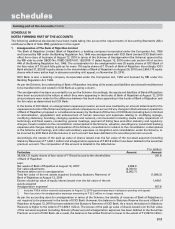
2. Earnings per share
Basic and diluted earnings per equity share are computed in accordance with AS 20 – Earnings per share. Basic earnings
per equity share is computed by dividing net profit after tax by the weighted average number of equity shares outstanding
during the year. The diluted earnings per equity share is computed using the weighted average number of equity shares
and dilutive potential equity shares outstanding during the year.
The following table sets forth, for the periods indicated, the computation of earnings per share.
` in million, except per share data
Year ended
March 31, 2011
Year ended
March 31, 2010
Basic
Weighted average no. of equity shares outstanding ......................................... 1,137,988,639 1,113,737,557
Net profit .............................................................................................................. 51,513.8 40,249.8
Basic earnings per share (`) ............................................................................... 45.27 36.14
Diluted
Weighted average no. of equity shares outstanding ......................................... 1,143,267,823 1,118,224,665
Net profit .............................................................................................................. 51,513.8 40,249.8
Diluted earnings per share (`) ............................................................................ 45.06 35.99
Nominal value per share (`) ................................................................................ 10.00 10.00
The dilutive impact is due to options granted to employees by the Bank.
3. Business/information ratios
The following table sets forth, for the periods indicated, the business/information ratios.
Year ended
March 31, 2011
Year ended
March 31, 2010
(i) Interest income to working funds1 ............................................................ 6.80% 7.19%
(ii) Non-interest income to working funds1 .................................................... 1.74% 2.09%
(iii) Operating profit to working funds1 ............................................................ 2.37% 2.72%
(iv) Return on assets2 ........................................................................................ 1.35% 1.13%
(v) Profit per employee (` in million)3 ............................................................. 1.0 0.9
(vi) Business (average deposits plus average advances)
per employee3, 4 (` in million) ..................................................................... 73.5 76.5
1. For the purpose of computing the ratio, working funds represent the average of total assets as reported in Form X to RBI under
Section 27 of the Banking Regulation Act, 1949.
2. For the purpose of computing the ratio, assets represent average total assets as reported to RBI in Form X under Section 27 of
the Banking Regulation Act, 1949.
3. The number of employees includes sales executives, employees on fixed term contracts and interns.
4. The average deposits and the average advances represent the simple average of the figures reported in Form A to RBI under
Section 42(2) of the Reserve Bank of India Act, 1934.
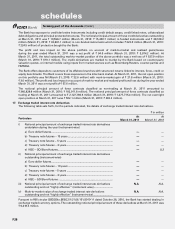
4. Capital adequacy ratio
The Bank is subject to the Basel II capital adequacy guidelines stipulated by the Reserve Bank of India (RBI) with effect
from March 31, 2008. The RBI guidelines on Basel II require the Bank to maintain a minimum capital to risk-weighted
assets ratio (CRAR) of 9.0% and a minimum Tier-1 CRAR of 6.0% on an ongoing basis.
RBI has also stipulated that banks shall maintain capital at higher of the minimum capital required as per Basel II or 80%
of the minimum capital required as per Basel I. At March 31, 2011, the prudential floor at 80% of the minimum capital
requirement under Basel I was ` 283,837.8 million and was lower than the minimum capital requirement of ` 307,348.2
million under Basel II. Hence, the Bank has maintained capital adequacy at March 31, 2011 as per the Basel II norms.
forming part of the Accounts (Contd.)
schedules