ICICI Bank 2011 Annual Report Download - page 55
Download and view the complete annual report
Please find page 55 of the 2011 ICICI Bank annual report below. You can navigate through the pages in the report by either clicking on the pages listed below, or by using the keyword search tool below to find specific information within the annual report.-
 1
1 -
2
-
3
-
4
-
5
-
6
-
7
-
8
-
9
-
10
-
11
-
12
-
13
-
14
-
15
-
16
-
17
-
18
-
19
-
20
-
21
-
22
-
23
-
24
-
25
-
26
-
27
-
28
-
29
-
30
-
31
-
32
-
33
-
34
-
35
-
36
-
37
-
38
-
39
-
40
-
41
-
42
-
43
-
44
-
 45
45 -
 46
46 -
 47
47 -
 48
48 -
 49
49 -
 50
50 -
 51
51 -
 52
52 -
 53
53 -
 54
54 -
 55
55 -
 56
56 -
 57
57 -
 58
58 -
 59
59 -
 60
60 -
 61
61 -
 62
62 -
 63
63 -
 64
64 -
 65
65 -
66
-
67
-
68
-
69
-
70
-
71
-
72
-
73
-
74
-
75
-
76
-
77
-
78
-
79
-
80
-
81
-
82
-
83
-
84
-
85
-
86
-
87
-
88
-
89
-
90
-
91
-
92
-
93
-
94
-
95
-
96
-
97
-
98
-
99
-
100
-
101
-
102
-
103
-
104
-
105
-
106
-
107
-
108
-
109
-
110
-
111
-
112
-
113
-
114
-
115
-
116
-
117
-
118
-
119
-
120
-
121
-
122
-
123
-
124
-
125
-
126
-
127
-
128
-
129
-
130
-
131
-
132
-
133
-
134
-
135
-
136
-
137
-
138
-
139
-
140
-
141
-
142
-
143
-
144
-
145
-
146
-
147
-
148
-
149
-
150
-
151
-
152
-
153
-
154
-
155
-
156
-
157
-
158
-
159
-
160
-
161
-
162
-
163
-
164
-
165
-
166
-
167
-
168
-
169
-
170
-
171
-
172
-
173
-
174
-
175
-
176
-
177
-
178
-
179
-
180
-
181
-
182
-
183
-
184
-
185
-
186
-
187
-
188
-
189
-
190
-
191
-
192
-
193
-
194
-
195
-
196
-
197
-
198
-
199
-
200
-
201
-
202
-
203
-
204
 |
 |

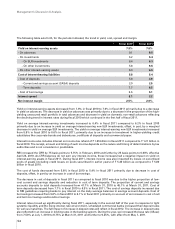
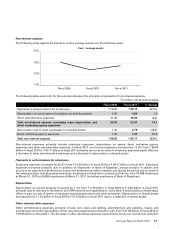
Key ratios
The following table sets forth, for the periods indicated, the key financial ratios.
Fiscal 2010 Fiscal 2011
Return on average equity (%)17.9 9.6
Return on average assets (%)21.1 1.3
Earnings per share (`) 36.14 45.27
Book value per share (`) 463.01 478.31
Fee to income (%) 36.6 41.2
Cost to income (%)337.0 41.9
1. Return on average equity is the ratio of the net profit after tax to the quarterly average equity share capital and reserves.
2. Return on average assets is the ratio of net profit after tax to average assets. The average balances are the averages of daily
balances, except averages of foreign branches which are calculated on a monthly basis till October 31, 2010 and on a fortnightly
basis thereafter.
3. Cost represents operating expense including DMA cost which is expensed upfront but excluding lease depreciation. Income
represents net interest income and non-interest income and is net of lease depreciation.
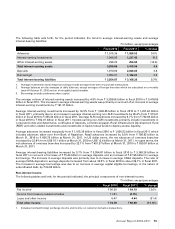
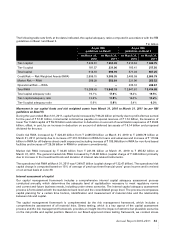
Net interest income and spread analysis
The following table sets forth, for the periods indicated, the net interest income and spread analysis.
` in billion, except percentages
Fiscal 2010 Fiscal 2011 % change
Interest income ` 257.07 ` 259.74 1.0%
Interest expense 175.93 169.57 (3.6)
Net interest income ` 81.14 ` 90.17 11.1
Average interest-earning assets13,259.66 3,418.59 4.9
Average interest-bearing liabilities1 3,054.87 3,168.26 3.7%
Net interest margin 2.5% 2.6% --
Average yield 7.9% 7.6% --
Average cost of funds 5.8% 5.4% --
Interest spread 2.1% 2.2% --
1. The average balances are the averages of daily balances, except averages of foreign branches which are calculated on monthly
basis till October 31, 2010 and on a fortnightly basis thereafter.
2. All amounts have been rounded off to the nearest ` 10.0 million.
Net interest income increased by 11.1% from ` 81.14 billion in fiscal 2010 to ` 90.17 billion in fiscal 2011 reflecting
an increase in net interest margin from 2.5% in fiscal 2010 to 2.6% in fiscal 2011 and a 4.9% increase in the average
volume of interest-earning assets.
Net interest margin increased from 2.5% in fiscal 2010 to 2.6% in fiscal 2011 primarily due to a decrease in cost of
deposits from 5.8% in fiscal 2010 to 4.9% in fiscal 2011, offset, in part by decrease in yield on interest-earning assets
from 7.9% in fiscal 2010 to 7.6% in fiscal 2011.
Annual Report 2010-2011 53