ICICI Bank 2011 Annual Report Download - page 54
Download and view the complete annual report
Please find page 54 of the 2011 ICICI Bank annual report below. You can navigate through the pages in the report by either clicking on the pages listed below, or by using the keyword search tool below to find specific information within the annual report.-
 1
1 -
2
-
3
-
4
-
5
-
6
-
7
-
8
-
9
-
10
-
11
-
12
-
13
-
14
-
15
-
16
-
17
-
18
-
19
-
20
-
21
-
22
-
23
-
24
-
25
-
26
-
27
-
28
-
29
-
30
-
31
-
32
-
33
-
34
-
35
-
36
-
37
-
38
-
39
-
40
-
41
-
42
-
43
-
 44
44 -
 45
45 -
 46
46 -
 47
47 -
 48
48 -
 49
49 -
 50
50 -
 51
51 -
 52
52 -
 53
53 -
 54
54 -
 55
55 -
 56
56 -
 57
57 -
 58
58 -
 59
59 -
 60
60 -
 61
61 -
 62
62 -
 63
63 -
 64
64 -
65
-
66
-
67
-
68
-
69
-
70
-
71
-
72
-
73
-
74
-
75
-
76
-
77
-
78
-
79
-
80
-
81
-
82
-
83
-
84
-
85
-
86
-
87
-
88
-
89
-
90
-
91
-
92
-
93
-
94
-
95
-
96
-
97
-
98
-
99
-
100
-
101
-
102
-
103
-
104
-
105
-
106
-
107
-
108
-
109
-
110
-
111
-
112
-
113
-
114
-
115
-
116
-
117
-
118
-
119
-
120
-
121
-
122
-
123
-
124
-
125
-
126
-
127
-
128
-
129
-
130
-
131
-
132
-
133
-
134
-
135
-
136
-
137
-
138
-
139
-
140
-
141
-
142
-
143
-
144
-
145
-
146
-
147
-
148
-
149
-
150
-
151
-
152
-
153
-
154
-
155
-
156
-
157
-
158
-
159
-
160
-
161
-
162
-
163
-
164
-
165
-
166
-
167
-
168
-
169
-
170
-
171
-
172
-
173
-
174
-
175
-
176
-
177
-
178
-
179
-
180
-
181
-
182
-
183
-
184
-
185
-
186
-
187
-
188
-
189
-
190
-
191
-
192
-
193
-
194
-
195
-
196
-
197
-
198
-
199
-
200
-
201
-
202
-
203
-
204
 |
 |

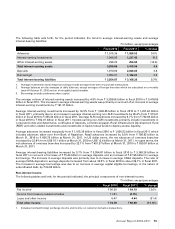
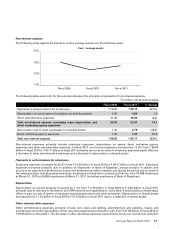
higher realised profit on government securities and other fixed income positions. Fee income increased by 13.6% from
` 56.50 billion in fiscal 2010 to ` 64.19 billion in fiscal 2011.
In fiscal 2011, non-interest expenses increased by 12.9% from ` 58.60 billion in fiscal 2010 to ` 66.17 billion in fiscal 2011
primarily due to an increase in employee expenses partly offset by a decrease in other administrative expenses.
Total assets increased by 11.8% from ` 3,634.00 billion at March 31, 2010 to ` 4,062.34 billion at March 31, 2011. Total
deposits increased by 11.7% from ` 2,020.17 billion at March 31, 2010 to ` 2,256.02 billion at March 31, 2011. Current
and savings account (CASA) deposits increased by 20.7% from ` 842.16 billion at March 31, 2010 to ` 1,016.47 billion at
March 31, 2011 while term deposits increased marginally from ` 1,178.01 billion at March 31, 2010 to ` 1,239.55 billion
at March 31, 2011. The ratio of CASA deposits to total deposits increased from 41.7% at March 31, 2010 to 45.1% at
March 31, 2011. Total advances increased by 19.4% from ` 1,812.06 billion at March 31, 2010 to ` 2,163.66 billion at
March 31, 2011 primarily due to an increase in domestic corporate loans, overseas corporate loans and loans taken
over from Bank of Rajasthan. Net non-performing assets decreased by 37.0% from ` 39.01 billion at March 31, 2010
to ` 24.58 billion at March 31, 2011 and the net non-performing asset ratio decreased from 1.9% at March 31, 2010 to
0.9% at March 31, 2011.
We continued to expand our branch network in India. Our branch network in India increased from 1,707 branches and
extension counters at March 31, 2010 to 2,529 branches and extension counters at March 31, 2011. We also increased
our ATM network from 5,219 ATMs at March 31, 2010 to 6,104 ATMs at March 31, 2011. These include branches and
ATMs of Bank of Rajasthan.
The total capital adequacy ratio of ICICI Bank on a standalone basis at March 31, 2011 in accordance with the RBI
guidelines on Basel II was 19.5% with a tier I capital adequacy ratio of 13.2% compared to a total capital adequacy of
19.4% and tier I capital adequacy of 14.0% at March 31, 2010.
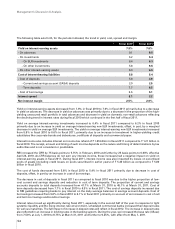
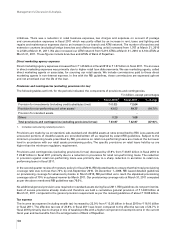
Operating results data
The following table sets forth, for the periods indicated, the operating results data.
` in billion, except percentages
Fiscal 2010 Fiscal 2011 % change
Interest income ` 257.07 ` 259.74 1.0%
Interest expense 175.93 169.57 (3.6)
Net interest income 81.14 90.17 11.1
Non-interest income
- Fee income156.50 64.19 13.6
- Treasury income 11.81 (2.15) -
- Lease and other income 6.47 4.44 (31.4)
Operating income 155.92 156.65 0.5
Operating expenses 55.93 63.81 14.1
Direct marketing agency (DMA) expense21.25 1.57 25.6
Lease depreciation, net of lease equalisation 1.42 0.79 (44.4)
Operating profit 97.32 90.48 (7.0)
Provisions, net of write-backs 43.87 22.87 (47.9)
Profit before tax 53.45 67.61 26.5
Tax, net of deferred tax 13.20 16.10 22.0
Profit after tax ` 40.25 ` 51.51 28.0%
1. Includes merchant foreign exchange income and margin on customer derivative transactions.
2. Represents commissions paid to DMAs for origination of retail loans. These commissions are expensed upfront.
3. All amounts have been rounded off to the nearest ` 10.0 million.
4. Prior period figures have been re-grouped/re-arranged, where necessary.
Management’s Discussion & Analysis
52