ICICI Bank 2011 Annual Report Download - page 56
Download and view the complete annual report
Please find page 56 of the 2011 ICICI Bank annual report below. You can navigate through the pages in the report by either clicking on the pages listed below, or by using the keyword search tool below to find specific information within the annual report.-
 1
1 -
2
-
3
-
4
-
5
-
6
-
7
-
8
-
9
-
10
-
11
-
12
-
13
-
14
-
15
-
16
-
17
-
18
-
19
-
20
-
21
-
22
-
23
-
24
-
25
-
26
-
27
-
28
-
29
-
30
-
31
-
32
-
33
-
34
-
35
-
36
-
37
-
38
-
39
-
40
-
41
-
42
-
43
-
44
-
45
-
 46
46 -
 47
47 -
 48
48 -
 49
49 -
 50
50 -
 51
51 -
 52
52 -
 53
53 -
 54
54 -
 55
55 -
 56
56 -
 57
57 -
 58
58 -
 59
59 -
 60
60 -
 61
61 -
 62
62 -
 63
63 -
 64
64 -
 65
65 -
 66
66 -
67
-
68
-
69
-
70
-
71
-
72
-
73
-
74
-
75
-
76
-
77
-
78
-
79
-
80
-
81
-
82
-
83
-
84
-
85
-
86
-
87
-
88
-
89
-
90
-
91
-
92
-
93
-
94
-
95
-
96
-
97
-
98
-
99
-
100
-
101
-
102
-
103
-
104
-
105
-
106
-
107
-
108
-
109
-
110
-
111
-
112
-
113
-
114
-
115
-
116
-
117
-
118
-
119
-
120
-
121
-
122
-
123
-
124
-
125
-
126
-
127
-
128
-
129
-
130
-
131
-
132
-
133
-
134
-
135
-
136
-
137
-
138
-
139
-
140
-
141
-
142
-
143
-
144
-
145
-
146
-
147
-
148
-
149
-
150
-
151
-
152
-
153
-
154
-
155
-
156
-
157
-
158
-
159
-
160
-
161
-
162
-
163
-
164
-
165
-
166
-
167
-
168
-
169
-
170
-
171
-
172
-
173
-
174
-
175
-
176
-
177
-
178
-
179
-
180
-
181
-
182
-
183
-
184
-
185
-
186
-
187
-
188
-
189
-
190
-
191
-
192
-
193
-
194
-
195
-
196
-
197
-
198
-
199
-
200
-
201
-
202
-
203
-
204
 |
 |

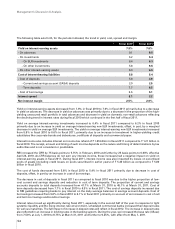
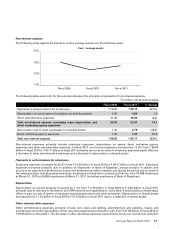
The following table sets forth, for the periods indicated, the trend in yield, cost, spread and margin.
Fiscal 2010 Fiscal 2011
Yield on interest-earning assets 7.9% 7.6%
- On advances 9.1 8.5
- On investments 6.2 6.4
- On SLR investments 6.4 6.3
- On other investments 5.8 6.6
- On other interest-earning assets 6.3 6.5
Cost of interest-bearing liabilities 5.8 5.4
- Cost of deposits 5.8 4.9
- Current and savings account (CASA) deposits 2.0 2.5
- Term deposits 7.7 6.5
- Cost of borrowings 5.6 6.1
Interest spread 2.1 2.2
Net interest margin 2.5% 2.6%
Yield on interest-earning assets decreased from 7.9% in fiscal 2010 to 7.6% in fiscal 2011 primarily due to a decrease
in yield on advances. The decrease in yield on advances was primarily due to a decrease in the proportion of the high-
yielding unsecured retail portfolio in total advances and decrease in yield on domestic non-retail advances reflecting
the declining trend in interest rates during fiscal 2010 which continued in the first half of fiscal 2011.
Yield on average interest-earning investments increased to 6.4% in fiscal 2011 compared to 6.2% in fiscal 2010
primarily due to an increase in yield on average interest-earning non-SLR investments, offset, in part, by a marginal
decrease in yield on average SLR investments. The yield on average interest-earning non-SLR investments increased
from 5.8% in fiscal 2010 to 6.6% in fiscal 2011, primarily due to an increase in investment in higher-yielding credit
substitutes like corporate bonds and debentures, certificate of deposits and commercial paper.
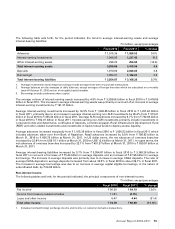
Interest income also includes interest on income tax refund of ` 1.65 billion in fiscal 2011 compared to ` 1.21 billion in
fiscal 2010. The receipt, amount and timing of such income depends on the nature and timing of determinations by tax
authorities and is not consistent or predictable.
RBI increased the CRR by 75 basis points to 5.75% in February 2010 and further by 25 basis points to 6.00% effective
April 24, 2010. As CRR balances do not earn any interest income, these increases had a negative impact on yield on
interest-earning assets in fiscal 2011. During fiscal 2011, interest income was also impacted by losses on securitised
pools of assets (including credit losses on pools securitised in earlier years) of ` 5.49 billion as compared to ` 5.09
billion in fiscal 2010.
The cost of funds decreased from 5.8% in fiscal 2010 to 5.4% in fiscal 2011 primarily due to decrease in cost of
deposits, offset, in part by an increase in cost of borrowings.
The decrease in cost of deposits in fiscal 2011 as compared to fiscal 2010 was due to the higher proportion of low-
cost current and savings deposits and reduction in cost of term deposits. The proportion of current and savings
accounts deposits to total deposits increased from 41.7% at March 31, 2010 to 45.1% at March 31, 2011. Cost of
term deposits decreased from 7.7% in fiscal 2010 to 6.5% in fiscal 2011. The cost of savings deposits increased due
to RBI guidelines requiring banks to pay interest on the daily average balances in savings account deposits. Cost of
borrowings increased from 5.6% in fiscal 2010 to 6.1% in fiscal 2011 primarily on account of an increase in cost of call
and term borrowings and bond borrowings.
Interest rates moved up significantly during fiscal 2011, especially in the second half of the year. In response to tight
systemic liquidity and the rising interest rate environment, scheduled commercial banks increased their deposit rates
for various maturities. The full impact of increase in deposit rates will reflect in fiscal 2012. The increase in deposit rates
also reflected in an increase in lending rates in the banking system. During the year, we increased the base rate (I-Base)
from 7.50% at July 1, 2010 to 8.75% at March 31, 2011 and further to 9.25%, with effect from May 7, 2011.
Management’s Discussion & Analysis
54