ICICI Bank 2011 Annual Report Download - page 113
Download and view the complete annual report
Please find page 113 of the 2011 ICICI Bank annual report below. You can navigate through the pages in the report by either clicking on the pages listed below, or by using the keyword search tool below to find specific information within the annual report.-
 1
1 -
2
-
3
-
4
-
5
-
6
-
7
-
8
-
9
-
10
-
11
-
12
-
13
-
14
-
15
-
16
-
17
-
18
-
19
-
20
-
21
-
22
-
23
-
24
-
25
-
26
-
27
-
28
-
29
-
30
-
31
-
32
-
33
-
34
-
35
-
36
-
37
-
38
-
39
-
40
-
41
-
42
-
43
-
44
-
45
-
46
-
47
-
48
-
49
-
50
-
51
-
52
-
53
-
54
-
55
-
56
-
57
-
58
-
59
-
60
-
61
-
62
-
63
-
64
-
65
-
66
-
67
-
68
-
69
-
70
-
71
-
72
-
73
-
74
-
75
-
76
-
77
-
78
-
79
-
80
-
81
-
82
-
83
-
84
-
85
-
86
-
87
-
88
-
89
-
90
-
91
-
92
-
93
-
94
-
95
-
96
-
97
-
98
-
99
-
100
-
101
-
102
-
 103
103 -
 104
104 -
 105
105 -
 106
106 -
 107
107 -
 108
108 -
 109
109 -
 110
110 -
 111
111 -
 112
112 -
 113
113 -
 114
114 -
 115
115 -
 116
116 -
 117
117 -
 118
118 -
 119
119 -
 120
120 -
 121
121 -
 122
122 -
 123
123 -
124
-
125
-
126
-
127
-
128
-
129
-
130
-
131
-
132
-
133
-
134
-
135
-
136
-
137
-
138
-
139
-
140
-
141
-
142
-
143
-
144
-
145
-
146
-
147
-
148
-
149
-
150
-
151
-
152
-
153
-
154
-
155
-
156
-
157
-
158
-
159
-
160
-
161
-
162
-
163
-
164
-
165
-
166
-
167
-
168
-
169
-
170
-
171
-
172
-
173
-
174
-
175
-
176
-
177
-
178
-
179
-
180
-
181
-
182
-
183
-
184
-
185
-
186
-
187
-
188
-
189
-
190
-
191
-
192
-
193
-
194
-
195
-
196
-
197
-
198
-
199
-
200
-
201
-
202
-
203
-
204
 |
 |

F35
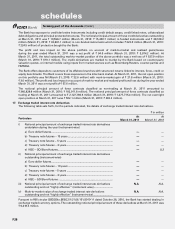
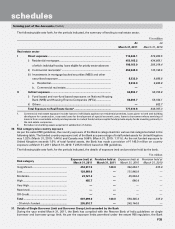
The following table sets forth, for the periods indicated, the summary of lending to real estate sector.
` in million
At
March 31, 2011
At
March 31, 2010
Real estate sector
I Direct exposure ...................................................................................... 712,446.1 579,950.5
i) Residential mortgages ......................................................................
of which: individual housing loans eligible for priority sector advances
453,165.2
190,163.0
434,865.1
205,019.4
ii) Commercial real estate1 ................................................................... 250,948.9 135,198.6
iii) Investments in mortgage backed securities (MBS) and other
securitised exposure ........................................................................ 8,332.0 9,886.8
a. Residential.................................................................................. 8,332.0 9,886.8
b. Commercial real estate.............................................................. ——
II Indirect exposure ................................................................................... 64,893.7 58,756.8
i) Fund based and non-fund based exposures on National Housing
Bank (NHB) and Housing Finance Companies (HFCs) .................... 64,893.7 58,104.1
ii) Others ............................................................................................... —652.7
Total Exposure to Real Estate Sector2.................................................. 777,339.8 638,707.3
1. Commercial real estate exposure include loans to individuals against non-residential premises, loans given to land and building
developers for construction, corporate loans for development of special economic zone, loans to borrowers where servicing of
loans is from a real estate activity and exposures to mutual funds/venture capital funds/private equity funds investing primarily in
the real estate companies.
2. Excludes non-banking assets acquired in satisfaction of claims.
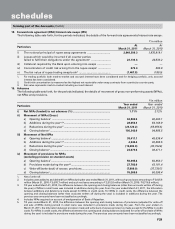
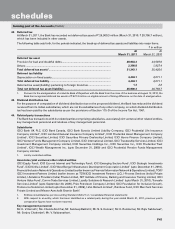
30. Risk category-wise country exposure
As per the extant RBI guidelines, the country exposure of the Bank is categorised into various risk categories listed in the
following table. The funded country exposure (net) of the Bank as a percentage of total funded assets for United Kingdom
was 1.32% (March 31, 2010: 1.44%) and Canada was 0.99% (March 31, 2010: 1.11%). As the net funded exposure to
United Kingdom exceeds 1.0% of total funded assets, the Bank has made a provision of ` 140.0 million on country
exposure at March 31, 2011 (March 31, 2010: ` 235.0 million) based on RBI guidelines.
The following table sets forth, for the periods indicated, the details of exposure (net) and provision held by the bank.
` in million
Risk category Exposure (net) at
March 31, 2011
Provision held at
March 31, 2011
Exposure (net) at
March 31, 2010
Provision held at
March 31, 2010
Insignificant ................................................ 452,917.5 140.0 392,684.7 235.0
Low ............................................................. 129,968.6 — 131,940.9 —
Moderate.................................................... 23,727.2 — 25,024.4 —
High ............................................................ 485.7 — 696.4 —
Very High ................................................... — — — —
Restricted ................................................... — — — —
Off-Credit ................................................... — — — —
Total ........................................................... 607,099.0 140.0 550,346.4 235.0
- Of which: funded .................................... 295,610.7 — 245,144.8 —
31. Details of Single Borrower Limit and Borrower Group Limit exceeded by the Bank
During the year ended March 31, 2011, the Bank has complied with the Reserve Bank of India guidelines on single
borrower and borrower group limit. As per the exposure limits permitted under the extant RBI regulation, the Bank
forming part of the Accounts (Contd.)
schedules