ICICI Bank 2011 Annual Report Download - page 156
Download and view the complete annual report
Please find page 156 of the 2011 ICICI Bank annual report below. You can navigate through the pages in the report by either clicking on the pages listed below, or by using the keyword search tool below to find specific information within the annual report.-
 1
1 -
2
-
3
-
4
-
5
-
6
-
7
-
8
-
9
-
10
-
11
-
12
-
13
-
14
-
15
-
16
-
17
-
18
-
19
-
20
-
21
-
22
-
23
-
24
-
25
-
26
-
27
-
28
-
29
-
30
-
31
-
32
-
33
-
34
-
35
-
36
-
37
-
38
-
39
-
40
-
41
-
42
-
43
-
44
-
45
-
46
-
47
-
48
-
49
-
50
-
51
-
52
-
53
-
54
-
55
-
56
-
57
-
58
-
59
-
60
-
61
-
62
-
63
-
64
-
65
-
66
-
67
-
68
-
69
-
70
-
71
-
72
-
73
-
74
-
75
-
76
-
77
-
78
-
79
-
80
-
81
-
82
-
83
-
84
-
85
-
86
-
87
-
88
-
89
-
90
-
91
-
92
-
93
-
94
-
95
-
96
-
97
-
98
-
99
-
100
-
101
-
102
-
103
-
104
-
105
-
106
-
107
-
108
-
109
-
110
-
111
-
112
-
113
-
114
-
115
-
116
-
117
-
118
-
119
-
120
-
121
-
122
-
123
-
124
-
125
-
126
-
127
-
128
-
129
-
130
-
131
-
132
-
133
-
134
-
135
-
136
-
137
-
138
-
139
-
140
-
141
-
142
-
143
-
144
-
145
-
 146
146 -
 147
147 -
 148
148 -
 149
149 -
 150
150 -
 151
151 -
 152
152 -
 153
153 -
 154
154 -
 155
155 -
 156
156 -
 157
157 -
 158
158 -
 159
159 -
 160
160 -
 161
161 -
 162
162 -
 163
163 -
 164
164 -
 165
165 -
 166
166 -
167
-
168
-
169
-
170
-
171
-
172
-
173
-
174
-
175
-
176
-
177
-
178
-
179
-
180
-
181
-
182
-
183
-
184
-
185
-
186
-
187
-
188
-
189
-
190
-
191
-
192
-
193
-
194
-
195
-
196
-
197
-
198
-
199
-
200
-
201
-
202
-
203
-
204
 |
 |

F78
forming part of the Consolidated Accounts (Contd.)
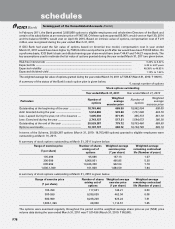
In February 2011, the Bank granted 3,035,000 options to eligible employees and whole-time Directors of the Bank and
certain of its subsidiaries at an exercise price of ` 967.00. Of these options granted 50.00% would vest on April 30, 2014
and the balance 50.00% would vest on April 30, 2015. Based on intrinsic value of options, compensation cost of ` 2.9
million was recognised during the year ended March 31, 2011.
If ICICI Bank had used the fair value of options based on binomial tree model, compensation cost in year ended
March 31, 2011 would have been higher by ` 905.8 million and proforma profit after tax would have been ` 50.60 billion. On
a proforma basis, ICICI Bank’s basic and diluted earnings per share would have been ` 44.47 and ` 44.27 respectively. The
key assumptions used to estimate the fair value of options granted during the year ended March 31, 2011 are given below.
The weighted average fair value of options granted during the year ended March 31, 2011 is ` 535.87 (March 31, 2010: ` 199.91).
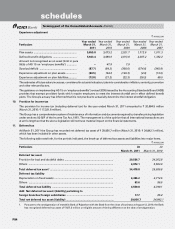
A summary of the status of the Bank’s stock option plan is given below.
Risk-free interest rate .................................................................................................................... 5.26% to 8.42%
Expected life .................................................................................................................................. 6.35 to 6.87 years
Expected volatility ......................................................................................................................... 48.38% to 49.82%
Expected dividend yield ................................................................................................................ 1.10% to 1.33%
Stock options outstanding
Year ended March 31, 2011 Year ended March 31, 2010
Particulars Number of
options
Weighted
average
exercise price
Number of
options
Weighted
average
exercise price
Outstanding at the beginning of the year ............... 18,763,460 689.50 18,992,504 685.05
Add: Granted during the year .................................. 5,514,600 972.00 1,731,000 434.78
Less: Lapsed during the year, net of re-issuance .... 1,005,536 871.95 365,372 661.78
Less: Exercised during the year ............................... 2,743,137 517.21 1,594,672 366.38
Outstanding at the end of the year .......................... 20,529,387 779.72 18,763,460 689.50
Options exercisable .................................................. 10,197,137 682.72 10,104,780 609.18
`, except number of options
In terms of the Scheme, 20,529,387 options (March 31, 2010: 18,763,460 options) granted to eligible employees were
outstanding at March 31, 2011.
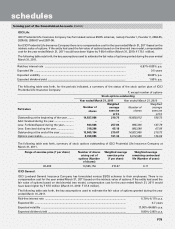
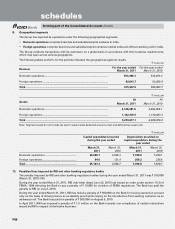
A summary of stock options outstanding at March 31, 2011 is given below.
Range of exercise price
(` per share)
Number of shares
arising out of
options
Weighted average
exercise price
(` per share)
Weighted average
remaining contractual
life (Number of years)
105-299 95,086 137.13 1.07
300-599 6,906,951 466.85 5.30
600-999 13,426,350 942.54 7.78
1,000-1,399 101,000 1,084.59 7.94
Range of exercise price
(` per share)
Number of shares
arising out of
options
Weighted average
exercise price
(` per share)
Weighted average
remaining contractual
life (Number of years)
105-299 117,601 146.21 2.03
300-599 9,339,639 462.04 6.08
600-999 9,238,220 923.24 7.61
1,000-1,399 68,000 1,114.57 7.65
A summary of stock options outstanding at March 31, 2010 is given below.
The options were exercised regularly throughout the period and the weighted average share price as per (NSE) price
volume data during the year ended March 31, 2011 was ` 1,014.96 (March 31, 2010: ` 853.80).
schedules