ICICI Bank 2011 Annual Report Download - page 67
Download and view the complete annual report
Please find page 67 of the 2011 ICICI Bank annual report below. You can navigate through the pages in the report by either clicking on the pages listed below, or by using the keyword search tool below to find specific information within the annual report.-
 1
1 -
2
-
3
-
4
-
5
-
6
-
7
-
8
-
9
-
10
-
11
-
12
-
13
-
14
-
15
-
16
-
17
-
18
-
19
-
20
-
21
-
22
-
23
-
24
-
25
-
26
-
27
-
28
-
29
-
30
-
31
-
32
-
33
-
34
-
35
-
36
-
37
-
38
-
39
-
40
-
41
-
42
-
43
-
44
-
45
-
46
-
47
-
48
-
49
-
50
-
51
-
52
-
53
-
54
-
55
-
56
-
 57
57 -
 58
58 -
 59
59 -
 60
60 -
 61
61 -
 62
62 -
 63
63 -
 64
64 -
 65
65 -
 66
66 -
 67
67 -
 68
68 -
 69
69 -
 70
70 -
 71
71 -
 72
72 -
 73
73 -
 74
74 -
 75
75 -
 76
76 -
 77
77 -
78
-
79
-
80
-
81
-
82
-
83
-
84
-
85
-
86
-
87
-
88
-
89
-
90
-
91
-
92
-
93
-
94
-
95
-
96
-
97
-
98
-
99
-
100
-
101
-
102
-
103
-
104
-
105
-
106
-
107
-
108
-
109
-
110
-
111
-
112
-
113
-
114
-
115
-
116
-
117
-
118
-
119
-
120
-
121
-
122
-
123
-
124
-
125
-
126
-
127
-
128
-
129
-
130
-
131
-
132
-
133
-
134
-
135
-
136
-
137
-
138
-
139
-
140
-
141
-
142
-
143
-
144
-
145
-
146
-
147
-
148
-
149
-
150
-
151
-
152
-
153
-
154
-
155
-
156
-
157
-
158
-
159
-
160
-
161
-
162
-
163
-
164
-
165
-
166
-
167
-
168
-
169
-
170
-
171
-
172
-
173
-
174
-
175
-
176
-
177
-
178
-
179
-
180
-
181
-
182
-
183
-
184
-
185
-
186
-
187
-
188
-
189
-
190
-
191
-
192
-
193
-
194
-
195
-
196
-
197
-
198
-
199
-
200
-
201
-
202
-
203
-
204
 |
 |

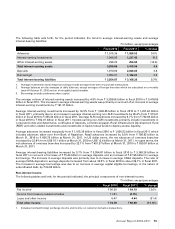
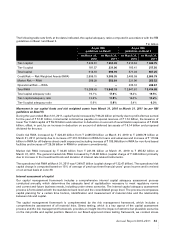
The following tables set forth, at the dates indicated, the composition of our gross advances (net of write-offs).
` in billion, except percentages
March 31, 2010 March 31, 2011
Advances % of total
advances
Advances % of total
advances
Retail finance1 ` 831.19 44.4% ` 890.74 39.7%
Services – non-finance 135.21 7.2 173.36 7.7
Services – finance 64.56 3.4 161.43 7.2
Crude petroleum/refining and petrochemicals 132.86 7.1 141.83 6.3
Road, ports, telecom, urban development and
other infrastructure
103.94 5.5 129.54 5.8
Power 56.49 3.0 98.11 4.4
Iron/steel and products 86.26 4.6 94.88 4.2
Food and beverages 61.54 3.3 70.63 3.2
Wholesale/retail trade 44.47 2.4 52.00 2.3
Electronics and engineering 31.54 1.7 44.72 2.0
Mining 4.57 0.2 41.49 1.9
Construction 17.91 1.0 36.43 1.6
Chemical and fertilizers 46.27 2.5 29.24 1.3
Textiles 19.16 1.0 21.01 0.9
Other industries2 237.17 12.7 258.74 11.5
Total ` 1,873.14 100.0% ` 2,244.15 100.0%
1. Includes home loans, automobile loans, commercial business loans, two wheeler loans, personal loans and credit cards. Also
includes dealer funding portfolio and developer financing portfolio.
2. Other industries primarily include automobiles, cement, drugs and pharmaceuticals, FMCG, gems and jewellery, manufacturing
products excluding metal, metal and products (excluding iron and steel) and shipping etc.
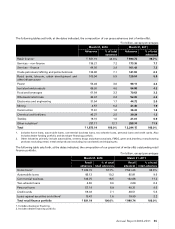
The following table sets forth, at the dates indicated, the composition of our gross (net of write-offs) outstanding retail
finance portfolio.
` in billion, except percentages
March 31, 2010 March 31, 2011
Retail
advances
% of total
retail advances
Retail
advances
% of total
retail advances
Home loans1` 474.72 57.1% ` 541.26 60.8%
Automobile loans 85.13 10.2 85.81 9.6
Commercial business 136.75 16.5 152.86 17.2
Two-wheeler loans 4.65 0.6 2.09 0.2
Personal loans 57.14 6.9 40.31 4.5
Credit cards 59.33 7.1 48.51 5.5
Loans against securities and others213.47 1.6 19.90 2.2
Total retail finance portfolio ` 831.19 100.0% ` 890.74 100.0%
1. Includes developer financing.
2. Includes dealer financing portfolio.
Annual Report 2010-2011 65