ICICI Bank 2011 Annual Report Download - page 71
Download and view the complete annual report
Please find page 71 of the 2011 ICICI Bank annual report below. You can navigate through the pages in the report by either clicking on the pages listed below, or by using the keyword search tool below to find specific information within the annual report.-
 1
1 -
2
-
3
-
4
-
5
-
6
-
7
-
8
-
9
-
10
-
11
-
12
-
13
-
14
-
15
-
16
-
17
-
18
-
19
-
20
-
21
-
22
-
23
-
24
-
25
-
26
-
27
-
28
-
29
-
30
-
31
-
32
-
33
-
34
-
35
-
36
-
37
-
38
-
39
-
40
-
41
-
42
-
43
-
44
-
45
-
46
-
47
-
48
-
49
-
50
-
51
-
52
-
53
-
54
-
55
-
56
-
57
-
58
-
59
-
60
-
 61
61 -
 62
62 -
 63
63 -
 64
64 -
 65
65 -
 66
66 -
 67
67 -
 68
68 -
 69
69 -
 70
70 -
 71
71 -
 72
72 -
 73
73 -
 74
74 -
 75
75 -
 76
76 -
 77
77 -
 78
78 -
 79
79 -
 80
80 -
 81
81 -
82
-
83
-
84
-
85
-
86
-
87
-
88
-
89
-
90
-
91
-
92
-
93
-
94
-
95
-
96
-
97
-
98
-
99
-
100
-
101
-
102
-
103
-
104
-
105
-
106
-
107
-
108
-
109
-
110
-
111
-
112
-
113
-
114
-
115
-
116
-
117
-
118
-
119
-
120
-
121
-
122
-
123
-
124
-
125
-
126
-
127
-
128
-
129
-
130
-
131
-
132
-
133
-
134
-
135
-
136
-
137
-
138
-
139
-
140
-
141
-
142
-
143
-
144
-
145
-
146
-
147
-
148
-
149
-
150
-
151
-
152
-
153
-
154
-
155
-
156
-
157
-
158
-
159
-
160
-
161
-
162
-
163
-
164
-
165
-
166
-
167
-
168
-
169
-
170
-
171
-
172
-
173
-
174
-
175
-
176
-
177
-
178
-
179
-
180
-
181
-
182
-
183
-
184
-
185
-
186
-
187
-
188
-
189
-
190
-
191
-
192
-
193
-
194
-
195
-
196
-
197
-
198
-
199
-
200
-
201
-
202
-
203
-
204
 |
 |

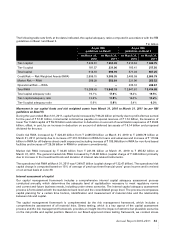
The standalone segmental report for the year ended March 31, 2011, based on the segments identified and defined by
RBI, has been presented as follows:
•Retail Banking includes exposures of the Bank, which satisfy the four qualifying criteria of ‘regulatory retail portfolio’
as stipulated by the RBI guidelines on the Basel II framework.
•Wholesale Banking includes all advances to trusts, partnership firms, companies and statutory bodies, by the Bank
which are not included in the Retail Banking segment, as per the RBI guidelines for the Bank.
•Treasury includes the entire investment portfolio of the Bank.
•Other Banking includes hire purchase and leasing operations and other items not attributable to any particular
business segment of the Bank.
Framework for Transfer Pricing
All liabilities are transfer priced to a central treasury unit, which pools all funds and lends to the business units
at appropriate rates based on the relevant maturity of assets being funded after adjusting for regulatory reserve
requirements and directed lending requirements.
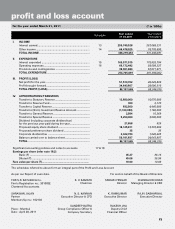
Retail Banking Segment
The loss in the retail banking segment decreased from ` 13.34 billion in fiscal 2010 to ` 5.14 billion in fiscal 2011,
primarily due to decline in provisions for loan losses in the unsecured portfolio, partly offset by decline in net interest
income and fee income.
Net interest income decreased by 11.7% from ` 37.59 billion in fiscal 2010 to ` 33.20 billion in fiscal 2011 primarily due
to reduction in the retail loan portfolio and the impact of increased cost of savings account deposits with effect from
April 1, 2010.
Non-interest income decreased by 19.2% from ` 26.19 billion in fiscal 2010 to ` 21.16 billion in fiscal 2011, primarily
due to reduction in credit card related fees following our conscious strategy of reducing the portfolio. Further, during
fiscal 2010, we had sold our merchant acquiring operations through a transfer of assets, primarily comprising fixed
assets, receivables and payables and assumption of liabilities to ICICI Merchant Services resulting in profit of ` 2.03
billion in our Retail Banking segment. Further, the fees from distribution of third-party products were impacted by
regulatory changes in the life insurance sector which led to decline in market volumes, changes in product mix and
lower distributor payouts.
Provisions decreased by 58.9% from ` 33.56 billion in fiscal 2010 to ` 13.81 billion in fiscal 2011, primarily due to
decline in provisions for loan losses in the unsecured retail portfolio. We have been taking various measures to contain
the non-performing asset (NPA) accretion in retail portfolio over the last two years. This has reflected in a sharp
reduction in provision requirements.
Wholesale Banking Segment
Profit before tax of the wholesale banking segment increased from ` 36.45 billion in fiscal 2010 to ` 49.00 billion in
fiscal 2011 primarily due to increase in fee income and decline in provisions offset, in part, by increase in non-interest
expenses.
Net interest income increased by 8.5% from ` 31.07 billion in fiscal 2010 to ` 33.72 billion in fiscal 2011 primarily due
to higher business volumes.
Non-interest income increased by 41.9% from ` 28.08 billion in fiscal 2010 to ` 39.85 billion in fiscal 2011. Fee income
increased due to our increased participation in financing to corporates for their term loan, working capital and project
financing requirements. During the year, there was an increase in loan processing related fees and transaction banking
related fees from corporate clients.
Provisions decreased from ` 10.34 billion in fiscal 2010 to ` 6.34 billion in fiscal 2011. Provisions were higher for fiscal
2010 on account of the significantly higher restructuring of corporate loans during the period.
Treasury Banking Segment
Profit before tax of the treasury segment decreased from ` 27.89 billion in fiscal 2010 to ` 22.01 billion in fiscal 2011,
primarily due to lower gains from treasury-related activities, offset, in part, by increase in net interest income.
Annual Report 2010-2011 69