ICICI Bank 2011 Annual Report Download - page 82
Download and view the complete annual report
Please find page 82 of the 2011 ICICI Bank annual report below. You can navigate through the pages in the report by either clicking on the pages listed below, or by using the keyword search tool below to find specific information within the annual report.-
 1
1 -
2
-
3
-
4
-
5
-
6
-
7
-
8
-
9
-
10
-
11
-
12
-
13
-
14
-
15
-
16
-
17
-
18
-
19
-
20
-
21
-
22
-
23
-
24
-
25
-
26
-
27
-
28
-
29
-
30
-
31
-
32
-
33
-
34
-
35
-
36
-
37
-
38
-
39
-
40
-
41
-
42
-
43
-
44
-
45
-
46
-
47
-
48
-
49
-
50
-
51
-
52
-
53
-
54
-
55
-
56
-
57
-
58
-
59
-
60
-
61
-
62
-
63
-
64
-
65
-
66
-
67
-
68
-
69
-
70
-
71
-
 72
72 -
 73
73 -
 74
74 -
 75
75 -
 76
76 -
 77
77 -
 78
78 -
 79
79 -
 80
80 -
 81
81 -
 82
82 -
 83
83 -
 84
84 -
 85
85 -
 86
86 -
 87
87 -
 88
88 -
 89
89 -
 90
90 -
 91
91 -
 92
92 -
93
-
94
-
95
-
96
-
97
-
98
-
99
-
100
-
101
-
102
-
103
-
104
-
105
-
106
-
107
-
108
-
109
-
110
-
111
-
112
-
113
-
114
-
115
-
116
-
117
-
118
-
119
-
120
-
121
-
122
-
123
-
124
-
125
-
126
-
127
-
128
-
129
-
130
-
131
-
132
-
133
-
134
-
135
-
136
-
137
-
138
-
139
-
140
-
141
-
142
-
143
-
144
-
145
-
146
-
147
-
148
-
149
-
150
-
151
-
152
-
153
-
154
-
155
-
156
-
157
-
158
-
159
-
160
-
161
-
162
-
163
-
164
-
165
-
166
-
167
-
168
-
169
-
170
-
171
-
172
-
173
-
174
-
175
-
176
-
177
-
178
-
179
-
180
-
181
-
182
-
183
-
184
-
185
-
186
-
187
-
188
-
189
-
190
-
191
-
192
-
193
-
194
-
195
-
196
-
197
-
198
-
199
-
200
-
201
-
202
-
203
-
204
 |
 |

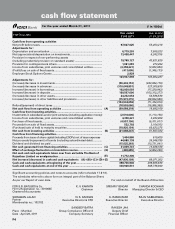
F4
(` in ‘000s)
cash flow statement
PARTICULARS Year ended
31.03.2011
Year ended
31.03.2010
Cash flow from operating activities
Net profit before taxes .................................................................................... 67,607,025 53,453,218
Adjustments for:
Depreciation and amortisation ....................................................................... 6,779,203 7,550,323
Net (appreciation)/depreciation on investments ............................................ 13,498,447 6,242,755
Provision in respect of non-performing assets
(including prudential provision on standard assets) ..................................... 19,769,127 43,621,629
Provision for contingencies & others .............................................................. 1,061,083 273,494
Income from subsidiaries, joint ventures and consolidated entities ............ (4,358,221) (3,933,959)
(Profit)/loss on sale of fixed assets ................................................................. (411,695) (1,345,173)
Employee Stock Options Grants .................................................................... 2,929 —
103,947,898 105,862,287
Adjustments for:
(Increase)/decrease in investments ................................................................ (56,232,153) (243,844,179)
(Increase)/decrease in advances .................................................................... (310,048,851) 327,300,630
Increase/(decrease) in borrowings ................................................................. 102,920,003 (17,220,942)
Increase/(decrease) in deposits ...................................................................... 100,567,606 (163,312,277)
(Increase)/decrease in other assets ................................................................ 24,232,654 54,586,538
Increase/(decrease) in other liabilities and provisions .................................. (15,973,315) (28,694,588)
(154,534,056) (71,184,818)
Refund/(payment) of direct taxes ................................................................... (18,503,060) (15,985,360)
Net cash flow from operating activities ....................................................... (A) (69,089,218) 18,692,109
Cash flow from investing activities ...............................................................
Investments in subsidiaries and/or joint ventures (including application money) (2,516,000) (1,113,156)
Income from subsidiaries, joint ventures and consolidated entities 4,358,221 3,933,959
Purchase of fixed assets.................................................................................. (4,557,106) (5,101,617)
Proceeds from sale of fixed assets ................................................................. 552,792 3,164,763
(Purchase)/sale of held to maturity securities ................................................ (18,926,154) 60,623,375
Net cash from investing activities ................................................................ (B) (21,088,247) 61,507,324
Cash flow from financing activities ...............................................................
Proceeds from issue of share capital (including ESOPs) net of issue expenses 1,404,886 610,429
Net proceeds/(repayment) of bonds (including subordinated debt) ............ 44,680,138 26,946,780
Dividend and dividend tax paid ...................................................................... (15,025,283) (13,731,041)
Net cash generated from financing activities............................................... (C) 31,059,741 13,826,168
Effect of exchange fluctuation on translation reserve ................................. (D) (490,685) (4,954,299)
Net cash and cash equivalents taken over from erstwhile The Bank of
Rajasthan Limited on amalgamation ............................................................ (E) 11,772,300 —
Net increase/(decrease) in cash and cash equivalents (A)+(B)+(C)+(D)+(E) (47,836,109) 89,071,302
Cash and cash equivalents at beginning of the year ................................... 388,736,940 299,665,638
Cash and cash equivalents at end of the year ............................................. 340,900,831 388,736,940
Significant accounting policies and notes to accounts (refer schedule 17 & 18).
The schedules referred to above form an integral part of the Balance Sheet.
As per our Report of even date. For and on behalf of the Board of Directors
FOR S.R. BATLIBOI & Co.
Firm’s Registration no.: 301003E
Chartered Accountants
K. V. KAMATH SRIDAR IYENGAR CHANDA KOCHHAR
Chairman Director Managing Director & CEO
SHRAWAN JALAN
Partner
Membership no.: 102102
N. S. KANNAN K. RAMKUMAR RAJIV SABHARWAL
Executive Director & CFO Executive Director Executive Director
SANDEEP BATRA RAKESH JHA
Place : Mumbai Group Compliance Officer &
Company Secretary
Deputy Chief
Financial Officer
Date : April 28, 2011
for the year ended March 31, 2011