ICICI Bank 2011 Annual Report Download - page 69
Download and view the complete annual report
Please find page 69 of the 2011 ICICI Bank annual report below. You can navigate through the pages in the report by either clicking on the pages listed below, or by using the keyword search tool below to find specific information within the annual report.-
 1
1 -
2
-
3
-
4
-
5
-
6
-
7
-
8
-
9
-
10
-
11
-
12
-
13
-
14
-
15
-
16
-
17
-
18
-
19
-
20
-
21
-
22
-
23
-
24
-
25
-
26
-
27
-
28
-
29
-
30
-
31
-
32
-
33
-
34
-
35
-
36
-
37
-
38
-
39
-
40
-
41
-
42
-
43
-
44
-
45
-
46
-
47
-
48
-
49
-
50
-
51
-
52
-
53
-
54
-
55
-
56
-
57
-
58
-
 59
59 -
 60
60 -
 61
61 -
 62
62 -
 63
63 -
 64
64 -
 65
65 -
 66
66 -
 67
67 -
 68
68 -
 69
69 -
 70
70 -
 71
71 -
 72
72 -
 73
73 -
 74
74 -
 75
75 -
 76
76 -
 77
77 -
 78
78 -
 79
79 -
80
-
81
-
82
-
83
-
84
-
85
-
86
-
87
-
88
-
89
-
90
-
91
-
92
-
93
-
94
-
95
-
96
-
97
-
98
-
99
-
100
-
101
-
102
-
103
-
104
-
105
-
106
-
107
-
108
-
109
-
110
-
111
-
112
-
113
-
114
-
115
-
116
-
117
-
118
-
119
-
120
-
121
-
122
-
123
-
124
-
125
-
126
-
127
-
128
-
129
-
130
-
131
-
132
-
133
-
134
-
135
-
136
-
137
-
138
-
139
-
140
-
141
-
142
-
143
-
144
-
145
-
146
-
147
-
148
-
149
-
150
-
151
-
152
-
153
-
154
-
155
-
156
-
157
-
158
-
159
-
160
-
161
-
162
-
163
-
164
-
165
-
166
-
167
-
168
-
169
-
170
-
171
-
172
-
173
-
174
-
175
-
176
-
177
-
178
-
179
-
180
-
181
-
182
-
183
-
184
-
185
-
186
-
187
-
188
-
189
-
190
-
191
-
192
-
193
-
194
-
195
-
196
-
197
-
198
-
199
-
200
-
201
-
202
-
203
-
204
 |
 |
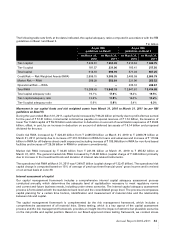
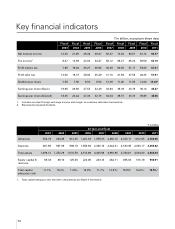
The following table sets forth, at March 31, 2010 and March 31, 2011, information regarding the classification of our
gross customer assets (net of write-offs, interest suspense and derivatives income reversal).
` in billion
March 31, 2010 March 31, 2011
Standard assets ` 2,057.29 ` 2,608.30
- Of which: Restructured loans 55.87 20.64
Non-performing assets 96.27 101.14
- Of which: Sub-standard assets 50.20 17.92
- Doubtful assets 40.30 74.00
- Loss assets 5.77 9.22
Total customer assets1` 2,153.56 ` 2,709.44
1. Customer assets include advances, lease receivables and credit substitutes like debentures and bonds but exclude preference
shares.
2. All amounts have been rounded off to the nearest ` 10.0 million.
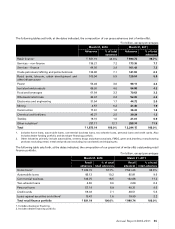
The following table sets forth, at the dates indicated, information regarding our non-performing assets (NPAs).
` in billion, except percentages
Year ended Gross NPA1Net NPA Net customer
assets
% of net NPA to net
customer assets2
March 31, 2009 ` 98.03 ` 46.19 ` 2,358.24 1.96%
March 31, 2010 96.27 39.01 2,091.22 1.87
March 31, 2011 ` 101.14 ` 24.58 ` 2,628.16 0.94%
1. Net of write-offs, interest suspense and derivatives income reversal.
2. Customer assets include advances and credit substitutes like debentures and bonds but exclude preference shares.
3. All amounts have been rounded off to the nearest ` 10.0 million.
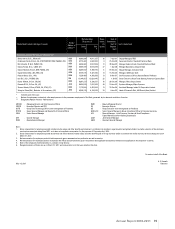
At March 31, 2011, the gross non-performing assets (net of write-offs, interest suspense and derivatives income
reversal) were ` 101.14 billion compared to ` 96.27 billion at March 31, 2010. The increased level of non-performing
assets was after taking into consideration the additions to gross NPA (` 4.11 billion) arising out of the amalgamation
of Bank of Rajasthan with effect from close of business at August 12, 2010. Net non-performing assets were ` 24.58
billion at March 31, 2011 compared to ` 39.01 billion at March 31, 2010. The ratio of net non-performing assets to net
customer assets decreased from 1.87% at March 31, 2010 to 0.94% at March 31, 2011. During fiscal 2011, we wrote-off
NPAs, including retail NPAs, with an aggregate outstanding of ` 2.29 billion against ` 28.48 billion during fiscal 2010.
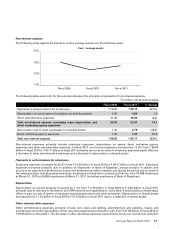
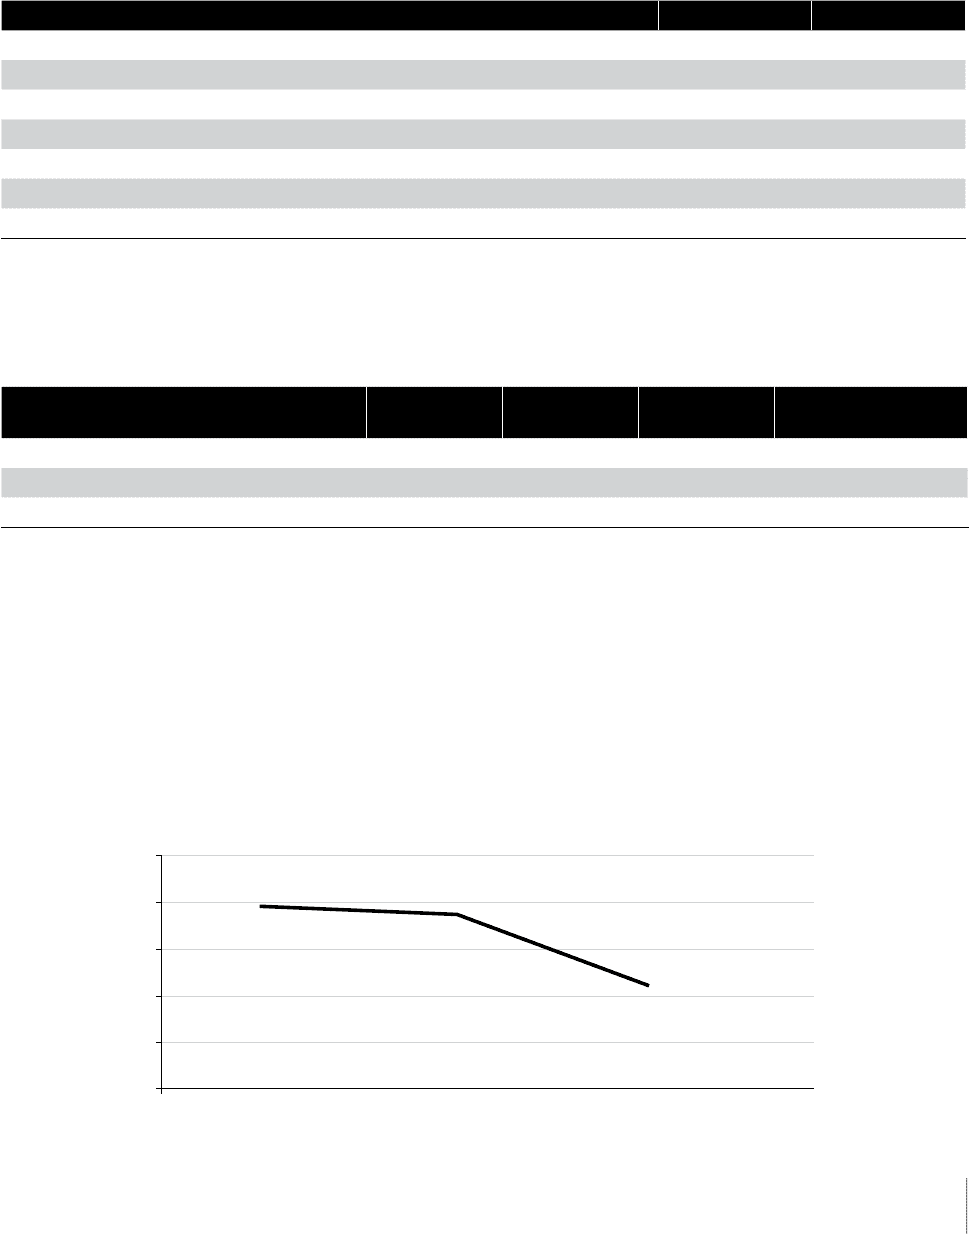
The following chart depicts the trends in the net non-performing assets ratio over the last three years.
March 2009 March 2010 March 2011
Net NPA Ratio
0.0%
0.5%
1.0%
1.5%
2.0%
2.5%
Annual Report 2010-2011 67