ICICI Bank 2011 Annual Report Download - page 139
Download and view the complete annual report
Please find page 139 of the 2011 ICICI Bank annual report below. You can navigate through the pages in the report by either clicking on the pages listed below, or by using the keyword search tool below to find specific information within the annual report.-
 1
1 -
2
-
3
-
4
-
5
-
6
-
7
-
8
-
9
-
10
-
11
-
12
-
13
-
14
-
15
-
16
-
17
-
18
-
19
-
20
-
21
-
22
-
23
-
24
-
25
-
26
-
27
-
28
-
29
-
30
-
31
-
32
-
33
-
34
-
35
-
36
-
37
-
38
-
39
-
40
-
41
-
42
-
43
-
44
-
45
-
46
-
47
-
48
-
49
-
50
-
51
-
52
-
53
-
54
-
55
-
56
-
57
-
58
-
59
-
60
-
61
-
62
-
63
-
64
-
65
-
66
-
67
-
68
-
69
-
70
-
71
-
72
-
73
-
74
-
75
-
76
-
77
-
78
-
79
-
80
-
81
-
82
-
83
-
84
-
85
-
86
-
87
-
88
-
89
-
90
-
91
-
92
-
93
-
94
-
95
-
96
-
97
-
98
-
99
-
100
-
101
-
102
-
103
-
104
-
105
-
106
-
107
-
108
-
109
-
110
-
111
-
112
-
113
-
114
-
115
-
116
-
117
-
118
-
119
-
120
-
121
-
122
-
123
-
124
-
125
-
126
-
127
-
128
-
 129
129 -
 130
130 -
 131
131 -
 132
132 -
 133
133 -
 134
134 -
 135
135 -
 136
136 -
 137
137 -
 138
138 -
 139
139 -
 140
140 -
 141
141 -
 142
142 -
 143
143 -
 144
144 -
 145
145 -
 146
146 -
 147
147 -
 148
148 -
 149
149 -
150
-
151
-
152
-
153
-
154
-
155
-
156
-
157
-
158
-
159
-
160
-
161
-
162
-
163
-
164
-
165
-
166
-
167
-
168
-
169
-
170
-
171
-
172
-
173
-
174
-
175
-
176
-
177
-
178
-
179
-
180
-
181
-
182
-
183
-
184
-
185
-
186
-
187
-
188
-
189
-
190
-
191
-
192
-
193
-
194
-
195
-
196
-
197
-
198
-
199
-
200
-
201
-
202
-
203
-
204
 |
 |

F61
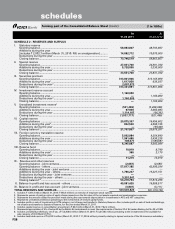
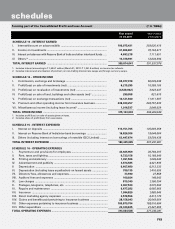
forming part of the Consolidated Balance Sheet (Contd.) (` in ‘000s)
SCHEDULE 9 - ADVANCES (net of provisions)
A. i) Bills purchased and discounted ............................................................. 70,301,265 47,219,427
ii) Cash credits, overdrafts and loans repayable on demand ................... 307,352,546 260,401,668
iii) Term loans .............................................................................................. 2,057,775,362 1,809,026,622
iv) Securitisation, finance lease and hire purchase receivables ................ 124,763,964 141,133,563
TOTAL ADVANCES .............................................................................................. 2,560,193,137 2,257,781,280
B. i) Secured by tangible assets [includes advances against book debts] .. 1,922,059,342 1,612,468,494
ii) Covered by bank/government guarantees ............................................ 27,057,409 21,202,426
iii) Unsecured................................................................................................ 611,076,386 624,110,360
TOTAL ADVANCES .............................................................................................. 2,560,193,137 2,257,781,280
C. I. Advances in India
i) Priority sector .................................................................................. 534,015,609 539,773,871
ii) Public sector .................................................................................... 13,788,639 3,201,088
iii) Banks ................................................................................................ 1,810,607 41,790
iv) Others .............................................................................................. 1,132,200,854 916,388,589
TOTAL ADVANCES IN INDIA ............................................................................... 1,681,815,709 1,459,405,338
II. Advances outside India
i) Loans to banks ................................................................................. 43,708,080 13,683,352
ii) Due from others
a) Bills purchased and discounted ................................................ 11,610,861 17,714,187
b) Syndicated and term loans ....................................................... 752,209,407 693,892,525
c) Others ......................................................................................... 70,849,080 73,085,878
TOTAL ADVANCES OUTSIDE INDIA .................................................................. 878,377,428 798,375,942
TOTAL ADVANCES ............................................................................................... 2,560,193,137 2,257,781,280
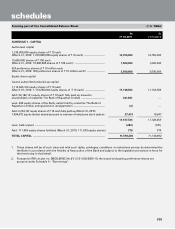
1. Includes acquisition cost of investment in associates of ` 578.7 million (March 31, 2010: ` 524.5 million).
2. Includes appreciation of ` 72,320.7 million (March 31, 2010: ` 93,112.5 million) on investments held to cover linked liabilities of life insurance business.
At
31.03.2011
At
31.03.2010
SCHEDULE 8 - INVESTMENTS
I. Investments in India (net of provisions)
i) Government securities .......................................................................... 732,979,973 732,093,813
ii) Other approved securities .................................................................... 356,398 45,009
iii) Shares (includes equity and preference shares)1 ................................. 41,536,041 42,426,779
iv) Debentures and bonds .......................................................................... 206,459,725 75,752,082
v) Assets held to cover linked liabilities of life insurance business ........ 588,265,347 514,692,566
vi) Others (commercial paper, mutual fund units, pass through
certificates, security receipts, certificate of deposits, Rural
Infrastructure Development Fund deposits and other related
investments etc.) ................................................................................... 388,530,238 337,886,043
TOTAL INVESTMENTS IN INDIA ........................................................................ 1,958,127,722 1,702,896,292
II. Investments outside India (net of provisions)
i) Government securities ......................................................................... 54,619,909 38,707,855
ii) Others ................................................................................................... 83,780,160 121,593,693
TOTAL INVESTMENTS OUTSIDE INDIA ............................................................ 138,400,069 160,301,548
TOTAL INVESTMENTS ........................................................................................ 2,096,527,791 1,863,197,840
III. Investments in India
Gross value of investments2 ......................................................................... 1,984,587,186 1,718,296,361
Less: Aggregate of provision/depreciation/(appreciation) ......................... 26,459,464 15,400,069
Net investments ............................................................................................ 1,958,127,722 1,702,896,292
IV. Investments outside India
Gross value of investments ......................................................................... 141,810,619 164,916,920
Less: Aggregate of provision/depreciation/(appreciation) ......................... 3,410,550 4,615,372
Net investments ............................................................................................ 138,400,069 160,301,548
TOTAL INVESTMENTS ........................................................................................ 2,096,527,791 1,863,197,840
schedules