ICICI Bank 2011 Annual Report Download - page 111
Download and view the complete annual report
Please find page 111 of the 2011 ICICI Bank annual report below. You can navigate through the pages in the report by either clicking on the pages listed below, or by using the keyword search tool below to find specific information within the annual report.-
 1
1 -
2
-
3
-
4
-
5
-
6
-
7
-
8
-
9
-
10
-
11
-
12
-
13
-
14
-
15
-
16
-
17
-
18
-
19
-
20
-
21
-
22
-
23
-
24
-
25
-
26
-
27
-
28
-
29
-
30
-
31
-
32
-
33
-
34
-
35
-
36
-
37
-
38
-
39
-
40
-
41
-
42
-
43
-
44
-
45
-
46
-
47
-
48
-
49
-
50
-
51
-
52
-
53
-
54
-
55
-
56
-
57
-
58
-
59
-
60
-
61
-
62
-
63
-
64
-
65
-
66
-
67
-
68
-
69
-
70
-
71
-
72
-
73
-
74
-
75
-
76
-
77
-
78
-
79
-
80
-
81
-
82
-
83
-
84
-
85
-
86
-
87
-
88
-
89
-
90
-
91
-
92
-
93
-
94
-
95
-
96
-
97
-
98
-
99
-
100
-
 101
101 -
 102
102 -
 103
103 -
 104
104 -
 105
105 -
 106
106 -
 107
107 -
 108
108 -
 109
109 -
 110
110 -
 111
111 -
 112
112 -
 113
113 -
 114
114 -
 115
115 -
 116
116 -
 117
117 -
 118
118 -
 119
119 -
 120
120 -
 121
121 -
122
-
123
-
124
-
125
-
126
-
127
-
128
-
129
-
130
-
131
-
132
-
133
-
134
-
135
-
136
-
137
-
138
-
139
-
140
-
141
-
142
-
143
-
144
-
145
-
146
-
147
-
148
-
149
-
150
-
151
-
152
-
153
-
154
-
155
-
156
-
157
-
158
-
159
-
160
-
161
-
162
-
163
-
164
-
165
-
166
-
167
-
168
-
169
-
170
-
171
-
172
-
173
-
174
-
175
-
176
-
177
-
178
-
179
-
180
-
181
-
182
-
183
-
184
-
185
-
186
-
187
-
188
-
189
-
190
-
191
-
192
-
193
-
194
-
195
-
196
-
197
-
198
-
199
-
200
-
201
-
202
-
203
-
204
 |
 |

F33
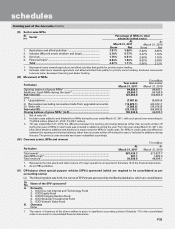
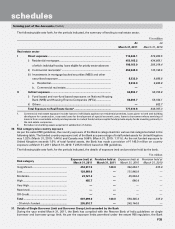
(II) Sector-wise NPAs
Sr.
no. Sector Percentage of NPAs to total
advances in that sector
At
March 31, 2011 At
March 31, 2010
Gross Net Gross Net
1. Agriculture and allied activities1 ........................................... 7.61% 3.00% 5.62% 3.05%
2. Industry (Micro & small, medium and large) ........................ 2.10% 0.77% 2.37% 1.19%
3. Services ................................................................................. 1.76% 0.51% 2.60% 1.16%
4. Personal loans2 ...................................................................... 9.84% 1.83% 9.02% 3.34%
Total ....................................................................................... 4.47% 1.11% 5.06% 2.12%
1. Represents loans towards agriculture and allied activities that qualify for priority sector lending.
2. Excludes retail loans towards agriculture and allied activities that qualify for priority sector lending. Excludes commercial
business loans, developer financing and dealer funding.
(III) Movement of NPAs
` in million
Particulars Year ended
March 31, 2011
Year ended
March 31, 2010
Opening balance of gross NPAs1 .............................................................. 94,806.5 96,493.1
Additions: fresh NPAs during the year2,3 ................................................... 28,656.3 64,168.9
Sub-total (A) ............................................................................................... 123,462.8 160,662.0
Less: ...........................................................................................................
i) Upgradations ....................................................................................... (7,581.6) (6,655.9)
ii) Recoveries (excluding recoveries made from upgraded accounts) . (13,670.1) (24,183.1)
iii) Write-offs ............................................................................................. (1,868.5) (35,016.5)
Sub-total (B) .............................................................................................. (23,120.2) (65,855.5)
Closing balance of gross NPAs1 (A-B) ..................................................... 100,342.6 94,806.5
1. Net of write-off.
2. Includes cases added to and deleted from NPAs during the year ended March 31, 2011, with such gross loans amounting to
` 5,025.8 million (March 31, 2010: ` 9,970.7 million).
3. Till year ended March 31, 2010, the difference between the opening and closing balances (other than accounts written off
during the year) of NPAs in retail loans was included in additions during the year. From the year ended March 31, 2011, the
bifurcation between additions and deletions is made except for NPAs in credit cards. For NPAs in credit cards, the difference
between the opening and closing balances (other than accounts written off during the year) is included in additions during
the year. The previous year amounts have been reclassified accordingly.
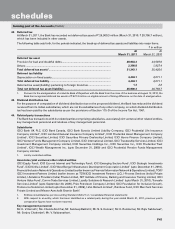
(IV) Overseas assets, NPAs and revenue
` in million
Particulars At
March 31, 2011
At
March 31, 2010
Total assets1 ............................................................................................... 697,435.3 611,827.7
Total NPAs (net)2 ........................................................................................ 981.1 1,593.3
Total revenue1 ............................................................................................ 39,309.8 44,598.1
1. Represents the total assets and total revenue of foreign operations as reported in Schedule 18 of the financial statements.
2. As per RBI guidelines.
(V) Off-balance sheet special purpose vehicles (SPVs) sponsored (which are required to be consolidated as per
accounting norms)
(a) The following table sets forth, the names of SPVs/trusts sponsored by the Bank/subsidiaries which are consolidated:
Sr.
No. Name of the SPV sponsored1
A. Domestic
1. ICICI Eco-net Internet and Technology Fund
2. ICICI Equity Fund
3. ICICI Emerging Sectors Fund
4. ICICI Strategic Investments Fund
5. ICICI Venture Value Fund
B. Overseas
None
1. The nature of business of the above entities is given in significant accounting policies (Schedule 17) in the consolidated
notes to accounts to consolidated financial statements.
forming part of the Accounts (Contd.)
schedules