ICICI Bank 2011 Annual Report Download - page 87
Download and view the complete annual report
Please find page 87 of the 2011 ICICI Bank annual report below. You can navigate through the pages in the report by either clicking on the pages listed below, or by using the keyword search tool below to find specific information within the annual report.-
 1
1 -
2
-
3
-
4
-
5
-
6
-
7
-
8
-
9
-
10
-
11
-
12
-
13
-
14
-
15
-
16
-
17
-
18
-
19
-
20
-
21
-
22
-
23
-
24
-
25
-
26
-
27
-
28
-
29
-
30
-
31
-
32
-
33
-
34
-
35
-
36
-
37
-
38
-
39
-
40
-
41
-
42
-
43
-
44
-
45
-
46
-
47
-
48
-
49
-
50
-
51
-
52
-
53
-
54
-
55
-
56
-
57
-
58
-
59
-
60
-
61
-
62
-
63
-
64
-
65
-
66
-
67
-
68
-
69
-
70
-
71
-
72
-
73
-
74
-
75
-
76
-
 77
77 -
 78
78 -
 79
79 -
 80
80 -
 81
81 -
 82
82 -
 83
83 -
 84
84 -
 85
85 -
 86
86 -
 87
87 -
 88
88 -
 89
89 -
 90
90 -
 91
91 -
 92
92 -
 93
93 -
 94
94 -
 95
95 -
 96
96 -
 97
97 -
98
-
99
-
100
-
101
-
102
-
103
-
104
-
105
-
106
-
107
-
108
-
109
-
110
-
111
-
112
-
113
-
114
-
115
-
116
-
117
-
118
-
119
-
120
-
121
-
122
-
123
-
124
-
125
-
126
-
127
-
128
-
129
-
130
-
131
-
132
-
133
-
134
-
135
-
136
-
137
-
138
-
139
-
140
-
141
-
142
-
143
-
144
-
145
-
146
-
147
-
148
-
149
-
150
-
151
-
152
-
153
-
154
-
155
-
156
-
157
-
158
-
159
-
160
-
161
-
162
-
163
-
164
-
165
-
166
-
167
-
168
-
169
-
170
-
171
-
172
-
173
-
174
-
175
-
176
-
177
-
178
-
179
-
180
-
181
-
182
-
183
-
184
-
185
-
186
-
187
-
188
-
189
-
190
-
191
-
192
-
193
-
194
-
195
-
196
-
197
-
198
-
199
-
200
-
201
-
202
-
203
-
204
 |
 |

F9
At
31.03.2011
At
31.03.2010
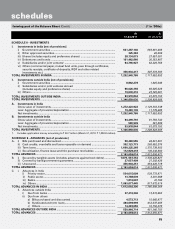
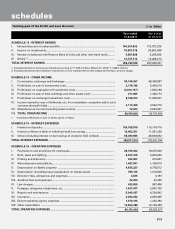
SCHEDULE 8 - INVESTMENTS
I. Investments in India [net of provisions]
i) Government securities ........................................................................................ 641,287,140 683,991,406
ii) Other approved securities ................................................................................... 325,363 45,009
iii) Shares (includes equity and preference shares) ............................................... 28,134,073 27,557,381
iv) Debentures and bonds ....................................................................................... 161,462,866 36,353,907
v) Subsidiaries and/or joint ventures1 ..................................................................... 64,796,927 62,226,766
vi) Others (commercial paper, mutual fund units, pass through certificates,
security receipts, certificate of deposits, RIDF and other related
investments etc.) ................................................................................................. 356,934,417 307,378,383
TOTAL INVESTMENTS IN INDIA ...................................................................................... 1,252,940,786 1,117,552,852
II. Investments outside India [net of provisions]
i) Government securities ........................................................................................ 8,862,278 1,645,046
ii) Subsidiaries and/or joint ventures abroad
(includes equity and preference shares) ............................................................ 66,026,356 66,005,026
iii) Others ................................................................................................................... 19,030,210 23,725,081
TOTAL INVESTMENTS OUTSIDE INDIA .......................................................................... 93,918,844 91,375,153
TOTAL INVESTMENTS ...................................................................................................... 1,346,859,630 1,208,928,005
A. Investments in India
Gross value of investments ....................................................................................... 1,272,423,922 1,129,332,338
Less: Aggregate of provision/depreciation ............................................................... 19,483,136 11,779,486
Net investments.......................................................................................................... 1,252,940,786 1,117,552,852
B. Investments outside India
Gross value of investments ....................................................................................... 94,499,793 91,756,742
Less: Aggregate of provision/depreciation ............................................................... 580,949 381,589
Net investments.......................................................................................................... 93,918,844 91,375,153
TOTAL INVESTMENTS ...................................................................................................... 1,346,859,630 1,208,928,005
1. Includes application money amounting to ` 50.7 million (March 31, 2010: ` 1,000.0 million).
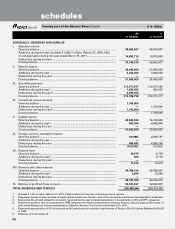
SCHEDULE 9 - ADVANCES [net of provisions]
A. i) Bills purchased and discounted .......................................................................... 58,480,555 44,531,591
ii) Cash credits, overdrafts and loans repayable on demand ................................ 302,123,773 255,552,276
iii) Term loans ............................................................................................................ 1,690,225,268 1,375,739,502
iv) Securitisation, finance lease and hire purchase receivables ............................ 112,829,418 136,232,602
TOTAL ADVANCES ............................................................................................................ 2,163,659,014 1,812,055,971
B. i) Secured by tangible assets (includes advances against book debts) ............... 1,679, 661,354 1,336,426,827
ii) Covered by bank/government guarantees ......................................................... 27,057,409 21,202,426
iii) Unsecured ............................................................................................................ 456,940,251 454,426,718
TOTAL ADVANCES ............................................................................................................ 2,163,659,014 1,812,055,971
C. I. Advances in India
i) Priority sector ................................................................................................ 534,015,609 539,773,871
ii) Public sector .................................................................................................. 13,788,639 3,201,088
iii) Banks ............................................................................................................. 1,810,607 41,790
iv) Others ............................................................................................................ 1,063,077,445 817,672,519
TOTAL ADVANCES IN INDIA ............................................................................................ 1,612,692,300 1,360,689,268
II. Advances outside India
i) Due from banks ............................................................................................ 37,410,346 13,515,963
ii) Due from others
a) Bills purchased and discounted ............................................................. 4,572,713 15,060,877
b) Syndicated and term loans ..................................................................... 494,699,999 412,037,485
c) Others ...................................................................................................... 14,283,656 10,752,378
TOTAL ADVANCES OUTSIDE INDIA ................................................................................ 550,966,714 451,366,703
TOTAL ADVANCES ............................................................................................................ 2,163,659,014 1,812,055,971
(` in ‘000s)
forming part of the Balance Sheet (Contd.)
schedules