ICICI Bank 2011 Annual Report Download - page 140
Download and view the complete annual report
Please find page 140 of the 2011 ICICI Bank annual report below. You can navigate through the pages in the report by either clicking on the pages listed below, or by using the keyword search tool below to find specific information within the annual report.-
 1
1 -
2
-
3
-
4
-
5
-
6
-
7
-
8
-
9
-
10
-
11
-
12
-
13
-
14
-
15
-
16
-
17
-
18
-
19
-
20
-
21
-
22
-
23
-
24
-
25
-
26
-
27
-
28
-
29
-
30
-
31
-
32
-
33
-
34
-
35
-
36
-
37
-
38
-
39
-
40
-
41
-
42
-
43
-
44
-
45
-
46
-
47
-
48
-
49
-
50
-
51
-
52
-
53
-
54
-
55
-
56
-
57
-
58
-
59
-
60
-
61
-
62
-
63
-
64
-
65
-
66
-
67
-
68
-
69
-
70
-
71
-
72
-
73
-
74
-
75
-
76
-
77
-
78
-
79
-
80
-
81
-
82
-
83
-
84
-
85
-
86
-
87
-
88
-
89
-
90
-
91
-
92
-
93
-
94
-
95
-
96
-
97
-
98
-
99
-
100
-
101
-
102
-
103
-
104
-
105
-
106
-
107
-
108
-
109
-
110
-
111
-
112
-
113
-
114
-
115
-
116
-
117
-
118
-
119
-
120
-
121
-
122
-
123
-
124
-
125
-
126
-
127
-
128
-
129
-
 130
130 -
 131
131 -
 132
132 -
 133
133 -
 134
134 -
 135
135 -
 136
136 -
 137
137 -
 138
138 -
 139
139 -
 140
140 -
 141
141 -
 142
142 -
 143
143 -
 144
144 -
 145
145 -
 146
146 -
 147
147 -
 148
148 -
 149
149 -
 150
150 -
151
-
152
-
153
-
154
-
155
-
156
-
157
-
158
-
159
-
160
-
161
-
162
-
163
-
164
-
165
-
166
-
167
-
168
-
169
-
170
-
171
-
172
-
173
-
174
-
175
-
176
-
177
-
178
-
179
-
180
-
181
-
182
-
183
-
184
-
185
-
186
-
187
-
188
-
189
-
190
-
191
-
192
-
193
-
194
-
195
-
196
-
197
-
198
-
199
-
200
-
201
-
202
-
203
-
204
 |
 |

F62
At
31.03.2011
At
31.03.2010
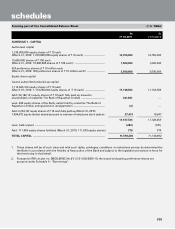
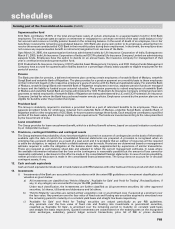
SCHEDULE 10 - FIXED ASSETS
I. Premises
At cost at March 31 of preceding year ......................................................... 28,681,193 29,563,202
Additions during the year1 ............................................................................. 18,438,137 1,369,012
Deductions during the year .......................................................................... (1,216,539) (2,251,021)
Depreciation to date ...................................................................................... (8,156,035) (6,472,554)
Net block2 ....................................................................................................... 37,746,756 22,208,639
II. Other fixed assets (including furniture and fixtures)
At cost at March 31 of preceding year ......................................................... 36,232,085 38,138,907
Additions during the year1 ............................................................................. 6,665,154 2,297,683
Deductions during the year .......................................................................... (1,456,215) (4,204,505)
Depreciation to date ...................................................................................... (26,862,655) (23,351,752)
Net block ........................................................................................................ 14,578,369 12,880,333
III. Assets given on Lease
At cost at March 31 of preceding year ......................................................... 17,760,500 17,961,174
Additions during the year ............................................................................. ——
Deductions during the year .......................................................................... (250,413) (200,674)
Depreciation to date, accumulated lease adjustment and provisions ........ (14,939,735) (14,226,548)
Net block ........................................................................................................ 2,570,352 3,533,952
TOTAL FIXED ASSETS .......................................................................................... 54,895,477 38,622,924
forming part of the Consolidated Balance Sheet (Contd.) (` in ‘000s)
1. Includes assets acquired from erstwhile The Bank of Rajasthan Limited for the year ended March 31, 2011.
2. Includes assets amounting to Nil (March 31, 2010: ` 446.1 million) which are in the process of being sold.
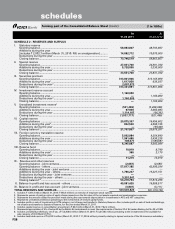
1. Includes certain non-banking assets acquired in satisfaction of claims which are in the process of being transferred in the Bank’s name.
2. Includes goodwill on consolidation amounting to ` 1,464.8 million (March 31, 2010: ` 1,514.4 million) and goodwill on purchase of assets by way of
merger amounting to Nil (March 31, 2010: ` 41.5 million).
1. Represents notional amount.
2. Includes an amount of ` 1,653.8 million pertaining to government securities settled after the Balance Sheet date, which are accounted as per settlement
date method pursuant to RBI guidelines issued during the year ended March 31, 2011.
SCHEDULE 11 - OTHER ASSETS
I. Inter-office adjustments (net debit) ............................................................. 207,829 —
II. Interest accrued ............................................................................................ 49,240,460 41,402,059
III. Tax paid in advance/tax deducted at source (net) ...................................... 37,124,889 39,651,493
I V. Stationery and stamps ................................................................................. 109,751 641
V. Non-banking assets acquired in satisfaction of claims1 .............................. 887,459 743,464
VI. Advance for capital assets ........................................................................... 1,418,588 11,907,171
VII. Deposits ........................................................................................................ 13,776,546 19,863,374
VIII. Deferred tax asset (net) ................................................................................ 29,936,668 24,842,072
IX. Others2 ........................................................................................................... 99,507,443 124,019,422
TOTAL OTHER ASSETS ....................................................................................... 232,209,633 262,429,696
SCHEDULE 12 - CONTINGENT LIABILITIES
I. Claims against the Group not acknowledged as debts .............................. 21,093,514 35,364,093
II. Liability for partly paid investments ............................................................ 128,050 128,126
III. Liability on account of outstanding forward exchange contracts1 ............. 2,550,667,789 1,753,368,882
I V. Guarantees given on behalf of constituents
a) In India ................................................................................................... 647,524,739 489,303,787
b) Outside India .......................................................................................... 182,021,705 129,981,831
V. Acceptances, endorsements and other obligations ................................... 393,972,235 321,795,858
VI. Currency swaps1 ........................................................................................... 567,720,233 506,938,754
VII. Interest rate swaps, currency options and interest rate futures1 ................ 5,800,967,594 4,846,442,184
VIII. Other items for which the Group is contingently liable2 ............................. 61,900,784 121,875,833
TOTAL CONTINGENT LIABILITIES ..................................................................... 10,225,996,643 8,205,199,348
schedules