ICICI Bank 2011 Annual Report Download - page 190
Download and view the complete annual report
Please find page 190 of the 2011 ICICI Bank annual report below. You can navigate through the pages in the report by either clicking on the pages listed below, or by using the keyword search tool below to find specific information within the annual report.-
 1
1 -
2
-
3
-
4
-
5
-
6
-
7
-
8
-
9
-
10
-
11
-
12
-
13
-
14
-
15
-
16
-
17
-
18
-
19
-
20
-
21
-
22
-
23
-
24
-
25
-
26
-
27
-
28
-
29
-
30
-
31
-
32
-
33
-
34
-
35
-
36
-
37
-
38
-
39
-
40
-
41
-
42
-
43
-
44
-
45
-
46
-
47
-
48
-
49
-
50
-
51
-
52
-
53
-
54
-
55
-
56
-
57
-
58
-
59
-
60
-
61
-
62
-
63
-
64
-
65
-
66
-
67
-
68
-
69
-
70
-
71
-
72
-
73
-
74
-
75
-
76
-
77
-
78
-
79
-
80
-
81
-
82
-
83
-
84
-
85
-
86
-
87
-
88
-
89
-
90
-
91
-
92
-
93
-
94
-
95
-
96
-
97
-
98
-
99
-
100
-
101
-
102
-
103
-
104
-
105
-
106
-
107
-
108
-
109
-
110
-
111
-
112
-
113
-
114
-
115
-
116
-
117
-
118
-
119
-
120
-
121
-
122
-
123
-
124
-
125
-
126
-
127
-
128
-
129
-
130
-
131
-
132
-
133
-
134
-
135
-
136
-
137
-
138
-
139
-
140
-
141
-
142
-
143
-
144
-
145
-
146
-
147
-
148
-
149
-
150
-
151
-
152
-
153
-
154
-
155
-
156
-
157
-
158
-
159
-
160
-
161
-
162
-
163
-
164
-
165
-
166
-
167
-
168
-
169
-
170
-
171
-
172
-
173
-
174
-
175
-
176
-
177
-
178
-
179
-
 180
180 -
 181
181 -
 182
182 -
 183
183 -
 184
184 -
 185
185 -
 186
186 -
 187
187 -
 188
188 -
 189
189 -
 190
190 -
 191
191 -
 192
192 -
 193
193 -
 194
194 -
 195
195 -
 196
196 -
 197
197 -
 198
198 -
 199
199 -
 200
200 -
201
-
202
-
203
-
204
 |
 |
F112
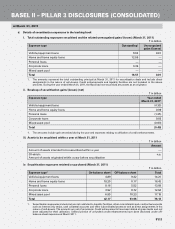
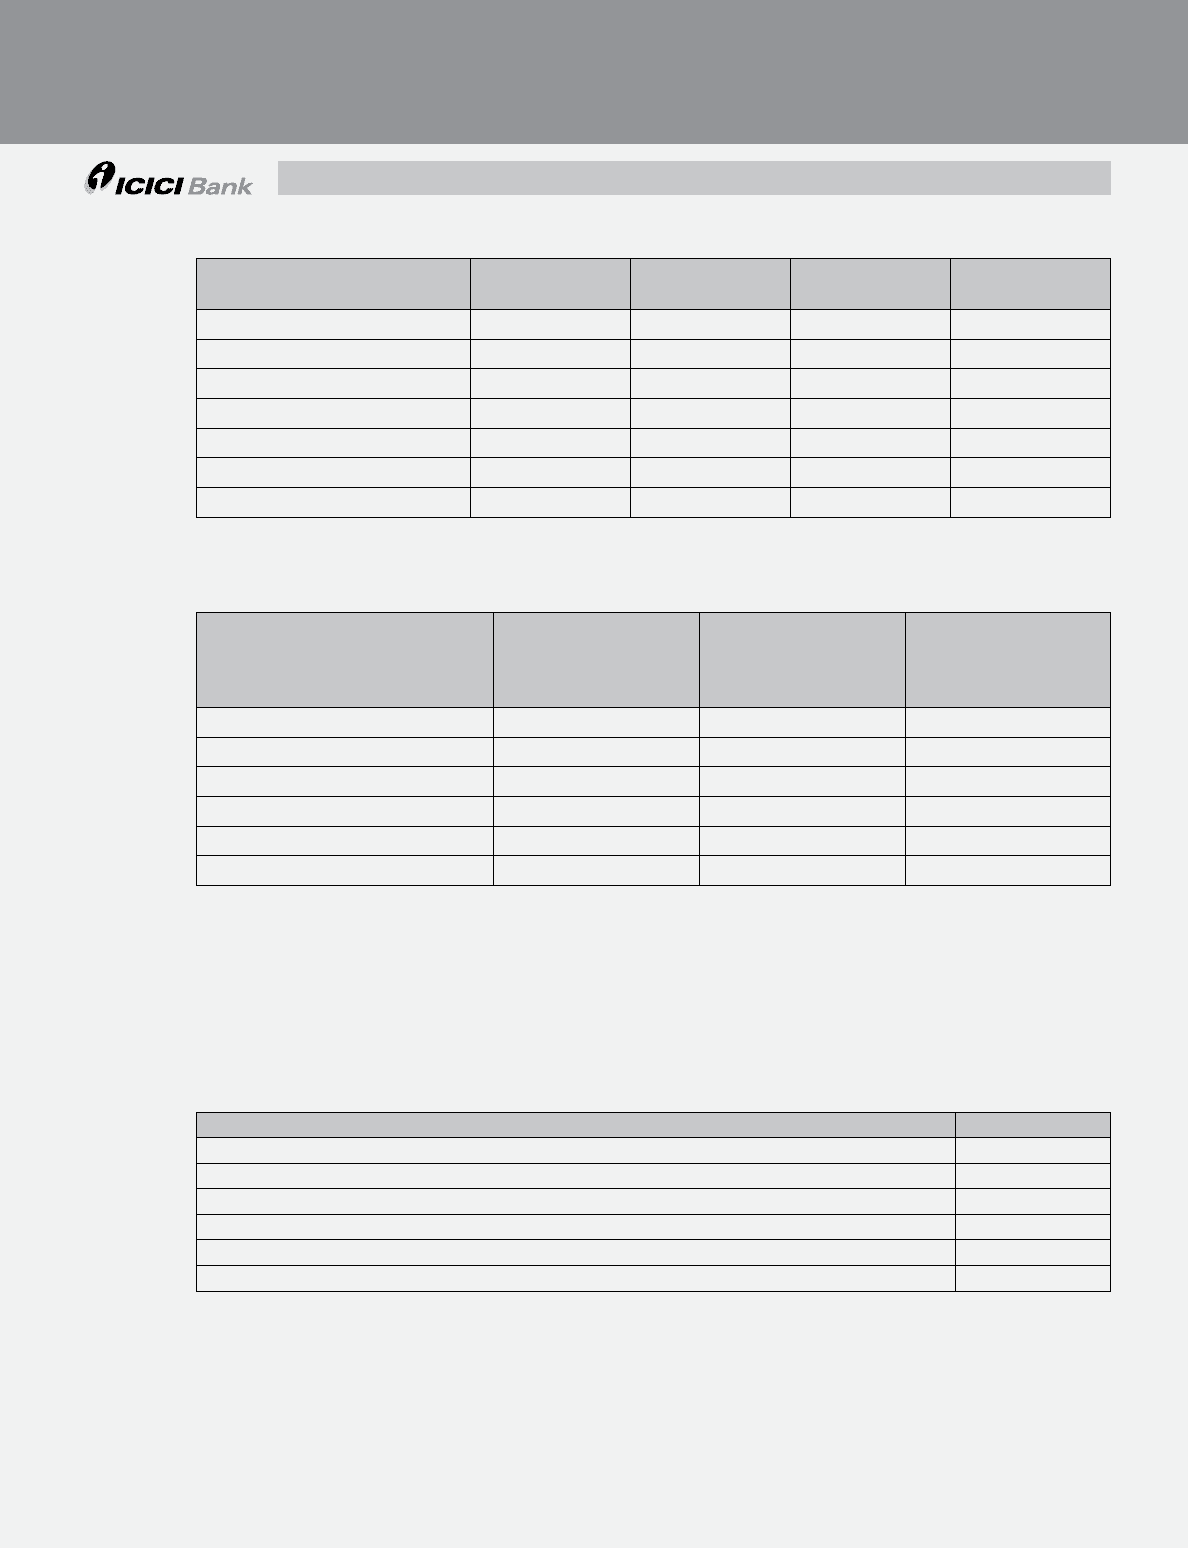
v. Risk weight bands break-up of securitisation exposures retained or purchased (March 31, 2011)
` in billion
Exposure type1<100% risk
weight
100% risk
weight
>100% risk
weight
Total
Vehicle/equipment loans 3.61 1.84 — 5.45
Home and home equity loans 7.78 3.25 — 11.03
Personal loans 3.74 — — 3.74
Corporate loans 8.88 1.33 0.32 10.53
Mixed asset pool 8.15 0.17 — 8.32
Total 32.16 6.59 0.32 39.07
Total capital charge 1.05 0.59 0.10 1.74
1. Includes direct assignments in the nature of sell-downs.
vi. Securitisation exposures deducted from capital (March 31, 2011)
` in billion
Exposure type1Exposures deducted
entirely from
Tier-1 capital
Credit enhancing
interest-only strips
deducted from
total capital2
Other exposures
deducted from
total capital3
Vehicle/equipment loans — 0.66 8.10
Home and home equity loans — 1.16 6.23
Personal loans — 1.53 8.42
Corporate loans — — 2.12
Mixed asset pool — 0.98 7.88
Total — 4.33 32.73
1. Includes direct assignments in the nature of sell-downs.
2. Includes subordinate contribution amount deducted from capital.
3. Includes credit enhancements (excluding interest only strips). Credit enhancements have been stated at gross levels and
not been adjusted for their utilisation. The amounts are net of provisions.
e. Details of securitisation exposures in the trading book
I. Aggregate amount of exposures securitised for which the Bank has retained some exposures subject to
market risk (March 31, 2011)
` in billion
Exposure type Total1
Vehicle/equipment loans 2.81
Home and home equity loans 3.13
Personal loans 0.21
Corporate loans —
Mixed asset pool 4.90
Total 11.05
1. The amounts represent the outstanding principal at March 31, 2011 for securitisation deals.
BASEL II – PILLAR 3 DISCLOSURES (CONSOLIDATED)
at March 31, 2011