ICICI Bank 2011 Annual Report Download - page 134
Download and view the complete annual report
Please find page 134 of the 2011 ICICI Bank annual report below. You can navigate through the pages in the report by either clicking on the pages listed below, or by using the keyword search tool below to find specific information within the annual report.-
 1
1 -
2
-
3
-
4
-
5
-
6
-
7
-
8
-
9
-
10
-
11
-
12
-
13
-
14
-
15
-
16
-
17
-
18
-
19
-
20
-
21
-
22
-
23
-
24
-
25
-
26
-
27
-
28
-
29
-
30
-
31
-
32
-
33
-
34
-
35
-
36
-
37
-
38
-
39
-
40
-
41
-
42
-
43
-
44
-
45
-
46
-
47
-
48
-
49
-
50
-
51
-
52
-
53
-
54
-
55
-
56
-
57
-
58
-
59
-
60
-
61
-
62
-
63
-
64
-
65
-
66
-
67
-
68
-
69
-
70
-
71
-
72
-
73
-
74
-
75
-
76
-
77
-
78
-
79
-
80
-
81
-
82
-
83
-
84
-
85
-
86
-
87
-
88
-
89
-
90
-
91
-
92
-
93
-
94
-
95
-
96
-
97
-
98
-
99
-
100
-
101
-
102
-
103
-
104
-
105
-
106
-
107
-
108
-
109
-
110
-
111
-
112
-
113
-
114
-
115
-
116
-
117
-
118
-
119
-
120
-
121
-
122
-
123
-
 124
124 -
 125
125 -
 126
126 -
 127
127 -
 128
128 -
 129
129 -
 130
130 -
 131
131 -
 132
132 -
 133
133 -
 134
134 -
 135
135 -
 136
136 -
 137
137 -
 138
138 -
 139
139 -
 140
140 -
 141
141 -
 142
142 -
 143
143 -
 144
144 -
145
-
146
-
147
-
148
-
149
-
150
-
151
-
152
-
153
-
154
-
155
-
156
-
157
-
158
-
159
-
160
-
161
-
162
-
163
-
164
-
165
-
166
-
167
-
168
-
169
-
170
-
171
-
172
-
173
-
174
-
175
-
176
-
177
-
178
-
179
-
180
-
181
-
182
-
183
-
184
-
185
-
186
-
187
-
188
-
189
-
190
-
191
-
192
-
193
-
194
-
195
-
196
-
197
-
198
-
199
-
200
-
201
-
202
-
203
-
204
 |
 |

F56
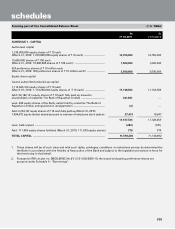
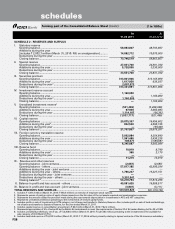
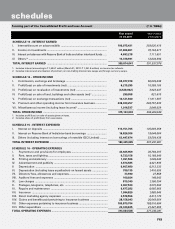
for the year ended March 31, 2011 (` in ‘000s)
Significant accounting policies and notes to accounts (refer schedule 17 & 18).
The schedules referred to above form an integral part of the Balance Sheet.
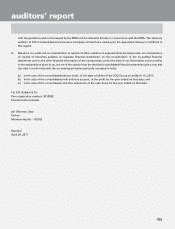
As per our Report of even date. For and on behalf of the Board of Directors
For S.R. BATLIBOI & CO.
Firm’s Registration no.: 301003E
Chartered Accountants
K. V. KAMATH SRIDAR IYENGAR CHANDA KOCHHAR
Chairman Director Managing Director & CEO
SHRAWAN JALAN
Partner
Membership no.: 102102
N. S. KANNAN K. RAMKUMAR RAJIV SABHARWAL
Executive Director & CFO Executive Director Executive Director
SANDEEP BATRA RAKESH JHA
Place : Mumbai Group Compliance Officer &
Company Secretary
Deputy Chief
Financial Officer
Date : April 28, 2011
consolidated cash flow statement
Particulars Year ended
31.03.2011
Year ended
31.03.2010
Cash flow from operating activities
Net profit before taxes .................................................................................. 81,647,759 64,055,237
Adjustments for :
Depreciation and amortisation ..................................................................... 8,576,451 9,085,111
Net (appreciation)/depreciation on investments .......................................... 14,541,573 4,526,200
Provision in respect of non-performing assets (including prudential
provision on standard assets) ....................................................................... 20,555,297 44,745,424
Provision for contingencies & others ........................................................... 1,881,817 513,461
(Profit)/loss on sale of fixed assets ............................................................... (299,958) (821,610)
126,902,939 122,103,823
Adjustments for :
(Increase)/decrease in investments .............................................................. (79,202,742) (216,921,819)
(Increase)/decrease in advances .................................................................. (261,585,581) 358,364,395
Increase/(decrease) in borrowings ............................................................... 75,360,723 (3,820,938)
Increase/(decrease) in deposits ................................................................... 40,049,589 (202,834,572)
(Increase)/decrease in other assets ............................................................. 25,485,114 28,724,367
Increase/(decrease) in other liabilities and provisions ................................ 58,660,309 229,307,649
(141,232,588) 192,819,082
(Payment)/refund of taxes (net) ................................................................... (22,046,919) (19,414,369)
Net cash flow from operating activities .................................................... (A) (36,376,568) 295,508,536
Cash flow from investing activities
Purchase of fixed assets ............................................................................... (8,940,934) (6,654,131)
Proceeds from sale of fixed assets .............................................................. 707,207 3,374,730
(Purchase)/sale of held to maturity securities ............................................. (52,576,194) (152,852,224)
Net cash generated from investing activities ........................................... (B) (60,809,921) (156,131,625)
Cash flow from financing activities
Proceeds from issue of share capital (including ESOPs) net of issue
expense ......................................................................................................... 1,426,887 1,175,994
Net proceeds/(repayment) of bonds (including subordinated debt) ......... 20,712,924 (1,247,434)
Dividend and dividend tax paid ................................................................... (15,567,579) (14,348,954)
Net cash generated from financing activities ............................................ (C) 6,572,232 (14,420,394)
Effect of exchange fluctuation on translation reserve .............................. (D) 1,253,363 (4,129,160)
Net cash and cash equivalents taken over from
The Bank of Rajasthan Limited on amalgamation .................................... (E) 11,772,300 —
Net increase/(decrease) in cash and cash equivalents .....(A)+(B)+(C)+(D)+(E) (77,588,594) 120,827,357
Cash and cash equivalents at April 1 ......................................................... 471,441,213 350,613,856
Cash and cash equivalents at March 31 .................................................... 393,852,619 471,441,213