ICICI Bank 2011 Annual Report Download - page 60
Download and view the complete annual report
Please find page 60 of the 2011 ICICI Bank annual report below. You can navigate through the pages in the report by either clicking on the pages listed below, or by using the keyword search tool below to find specific information within the annual report.-
 1
1 -
2
-
3
-
4
-
5
-
6
-
7
-
8
-
9
-
10
-
11
-
12
-
13
-
14
-
15
-
16
-
17
-
18
-
19
-
20
-
21
-
22
-
23
-
24
-
25
-
26
-
27
-
28
-
29
-
30
-
31
-
32
-
33
-
34
-
35
-
36
-
37
-
38
-
39
-
40
-
41
-
42
-
43
-
44
-
45
-
46
-
47
-
48
-
49
-
 50
50 -
 51
51 -
 52
52 -
 53
53 -
 54
54 -
 55
55 -
 56
56 -
 57
57 -
 58
58 -
 59
59 -
 60
60 -
 61
61 -
 62
62 -
 63
63 -
 64
64 -
 65
65 -
 66
66 -
 67
67 -
 68
68 -
 69
69 -
 70
70 -
71
-
72
-
73
-
74
-
75
-
76
-
77
-
78
-
79
-
80
-
81
-
82
-
83
-
84
-
85
-
86
-
87
-
88
-
89
-
90
-
91
-
92
-
93
-
94
-
95
-
96
-
97
-
98
-
99
-
100
-
101
-
102
-
103
-
104
-
105
-
106
-
107
-
108
-
109
-
110
-
111
-
112
-
113
-
114
-
115
-
116
-
117
-
118
-
119
-
120
-
121
-
122
-
123
-
124
-
125
-
126
-
127
-
128
-
129
-
130
-
131
-
132
-
133
-
134
-
135
-
136
-
137
-
138
-
139
-
140
-
141
-
142
-
143
-
144
-
145
-
146
-
147
-
148
-
149
-
150
-
151
-
152
-
153
-
154
-
155
-
156
-
157
-
158
-
159
-
160
-
161
-
162
-
163
-
164
-
165
-
166
-
167
-
168
-
169
-
170
-
171
-
172
-
173
-
174
-
175
-
176
-
177
-
178
-
179
-
180
-
181
-
182
-
183
-
184
-
185
-
186
-
187
-
188
-
189
-
190
-
191
-
192
-
193
-
194
-
195
-
196
-
197
-
198
-
199
-
200
-
201
-
202
-
203
-
204
 |
 |
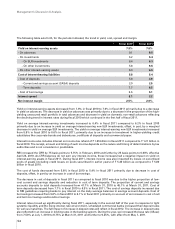
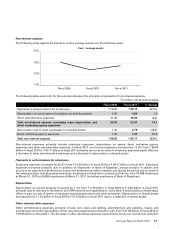
initiatives. There was a reduction in retail business expenses, law charges and expenses on account of postage
and communication expenses in fiscal 2011 which was partly offset by an increase in rent, taxes and lighting and
repairs and maintenance expenses due to an increase in our branch and ATM network. The number of branches and
extension counters (excluding foreign branches and offshore banking units) increased from 1,707 at March 31, 2010
to 2,529 at March 31, 2011. We also increased our ATM network from 5,219 ATMs at March 31, 2010 to 6,104 ATMs at
March 31, 2011. These figures include branches and ATMs of Bank of Rajasthan.
Direct marketing agency expenses
Direct marketing agency expenses increased from ` 1.25 billion in fiscal 2010 to ` 1.57 billion in fiscal 2011. The increase
in direct marketing expenses was primarily due to higher retail loan disbursements. We use marketing agents, called
direct marketing agents or associates, for sourcing our retail assets. We include commissions paid to these direct
marketing agents in non-interest expense. In line with the RBI guidelines, these commissions are expensed upfront
and not amortised over the life of the loan.
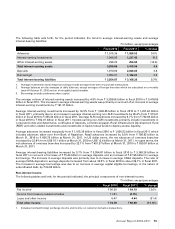
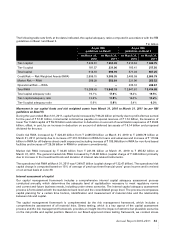
Provisions and contingencies (excluding provisions for tax)
The following tables set forth, for the periods indicated, the components of provisions and contingencies.
` in billion, except percentages
Fiscal 2010 Fiscal 2011 % change
Provision for investments (including credit substitutes) (net) ` (0.03) ` 2.04 -
Provision for non-performing and other assets143.62 19.77 (54.7)%
Provision for standard assets - -
Others 0.28 1.06
Total provisions and contingencies (excluding provisions for tax) ` 43.87 ` 22.87 (47.9)%
1. Includes restructuring related provision.
Provisions are made by us on standard, sub-standard and doubtful assets at rates prescribed by RBI. Loss assets and
unsecured portions of doubtful assets are provided/written off as required by extant RBI guidelines. Subject to the
minimum provisioning levels prescribed by RBI, provisions on retail non-performing loans are made at the borrower
level in accordance with our retail assets provisioning policy. The specific provisions on retail loans held by us are
higher than the minimum regulatory requirement.
Provisions and contingencies (excluding provisions for tax) decreased by 47.9% from ` 43.87 billion in fiscal 2010 to
` 22.87 billion in fiscal 2011 primarily due to a reduction in provisions for retail non-performing loans. The reduction
in provision against retail non-performing loans was primarily due to a sharp reduction in accretion to retail non-
performing loans in fiscal 2011.
In the second quarter review of monetary policy for fiscal 2010, RBI directed banks to ensure that their total provisioning
coverage ratio was not less than 70% by end-September 2010. On December 1, 2009, RBI issued detailed guidelines
on provisioning coverage for advances by banks. In March 2010, RBI permitted us to reach the stipulated provisioning
coverage ratio of 70% in a phased manner by March 2011. Our provisioning coverage ratio at March 31, 2011 computed
as per the above mentioned RBI guidelines was 76.0%.
No additional general provision was required on standard assets during fiscal 2011. RBI guidelines do not permit write-
back of excess provisions already made and therefore we held a cumulative general provision of ` 14.80 billion at
March 31, 2011 compared to the general provision requirement as per the revised guidelines of about ` 10.86 billion.
Tax expense
The income tax expense (including wealth tax) increased by 22.0% from ` 13.20 billion in fiscal 2010 to ` 16.10 billion
in fiscal 2011. The effective tax rate of 23.8% in fiscal 2011 was lower compared to the effective tax rate of 24.7% in
fiscal 2010 primarily due to change in mix of taxable profits with a higher component of exempt income in the current
fiscal year and tax benefits from the amalgamation of Bank of Rajasthan.
Management’s Discussion & Analysis
58