ICICI Bank 2011 Annual Report Download - page 62
Download and view the complete annual report
Please find page 62 of the 2011 ICICI Bank annual report below. You can navigate through the pages in the report by either clicking on the pages listed below, or by using the keyword search tool below to find specific information within the annual report.-
 1
1 -
2
-
3
-
4
-
5
-
6
-
7
-
8
-
9
-
10
-
11
-
12
-
13
-
14
-
15
-
16
-
17
-
18
-
19
-
20
-
21
-
22
-
23
-
24
-
25
-
26
-
27
-
28
-
29
-
30
-
31
-
32
-
33
-
34
-
35
-
36
-
37
-
38
-
39
-
40
-
41
-
42
-
43
-
44
-
45
-
46
-
47
-
48
-
49
-
50
-
51
-
 52
52 -
 53
53 -
 54
54 -
 55
55 -
 56
56 -
 57
57 -
 58
58 -
 59
59 -
 60
60 -
 61
61 -
 62
62 -
 63
63 -
 64
64 -
 65
65 -
 66
66 -
 67
67 -
 68
68 -
 69
69 -
 70
70 -
 71
71 -
 72
72 -
73
-
74
-
75
-
76
-
77
-
78
-
79
-
80
-
81
-
82
-
83
-
84
-
85
-
86
-
87
-
88
-
89
-
90
-
91
-
92
-
93
-
94
-
95
-
96
-
97
-
98
-
99
-
100
-
101
-
102
-
103
-
104
-
105
-
106
-
107
-
108
-
109
-
110
-
111
-
112
-
113
-
114
-
115
-
116
-
117
-
118
-
119
-
120
-
121
-
122
-
123
-
124
-
125
-
126
-
127
-
128
-
129
-
130
-
131
-
132
-
133
-
134
-
135
-
136
-
137
-
138
-
139
-
140
-
141
-
142
-
143
-
144
-
145
-
146
-
147
-
148
-
149
-
150
-
151
-
152
-
153
-
154
-
155
-
156
-
157
-
158
-
159
-
160
-
161
-
162
-
163
-
164
-
165
-
166
-
167
-
168
-
169
-
170
-
171
-
172
-
173
-
174
-
175
-
176
-
177
-
178
-
179
-
180
-
181
-
182
-
183
-
184
-
185
-
186
-
187
-
188
-
189
-
190
-
191
-
192
-
193
-
194
-
195
-
196
-
197
-
198
-
199
-
200
-
201
-
202
-
203
-
204
 |
 |
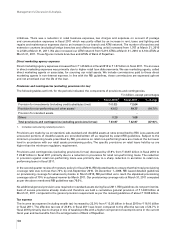
Fixed and other assets
Fixed assets increased by 47.7% from ` 32.13 billion at March 31, 2010 to ` 47.44 billion at March 31, 2011 (including
` 5.15 billion of Bank of Rajasthan at August 12, 2010) primarily due to part capitalisation of the Bank’s new building
in Hyderabad and increase in the branch network and other offices. Other assets decreased by 14.9% from ` 192.15
billion at March 31, 2010 to ` 163.48 billion at March 31, 2011.
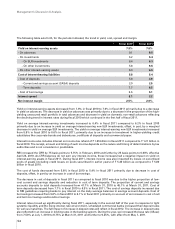
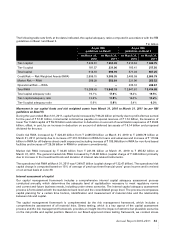
Liabilities
The following table sets forth, at the dates indicated, the principal components of liabilities (including capital and reserves).
` in billion, except percentages
Liabilities At March 31, 2010 At March 31, 2011 % change
Equity share capital 11.15 11.52 3.3
Reserves 505.03 539.39 6.8
Deposits 2,020.17 2,256.02 11.7
- Savings deposits 532.18 668.69 25.7
- Current deposits 309.98 347.78 12.2
- Term deposits 1,178.01 1,239.55 5.2
Borrowings (excluding sub-ordinated debt and preference
share capital)
609.47 728.13 19.5
- Domestic 140.21 192.75 37.5
- Overseas 469.26 535.38 14.1
Subordinated debt (included in Tier-1 and Tier-2 capital)1329.672363.91 10.4
- Domestic1314.472348.80 10.9
- Overseas 15.20 15.11 (0.6)
Preference share capital 3.50 3.50 -
Other liabilities 155.01 159.87 3.1
Total liabilities ` 3,634.00 ` 4,062.34 11.8%
1. Included in Schedule 4 - “Borrowings” of the balance sheet.
2. Includes application money of ` 25.00 billion received towards subordinated debt issued on April 5, 2010.
3. All amounts have been rounded off to the nearest ` 10.0 million.
Total liabilities (including capital and reserves) increased by 11.8% from ` 3,634.00 billion at March 31, 2010 to
` 4,062.34 billion at March 31, 2011 (including ` 155.96 billion of Bank of Rajasthan at August 12, 2010), primarily due
to an increase in deposits and borrowings. Deposits increased from ` 2,020.17 billion at March 31, 2010 to ` 2,256.02
billion at March 31, 2011.
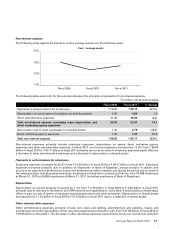
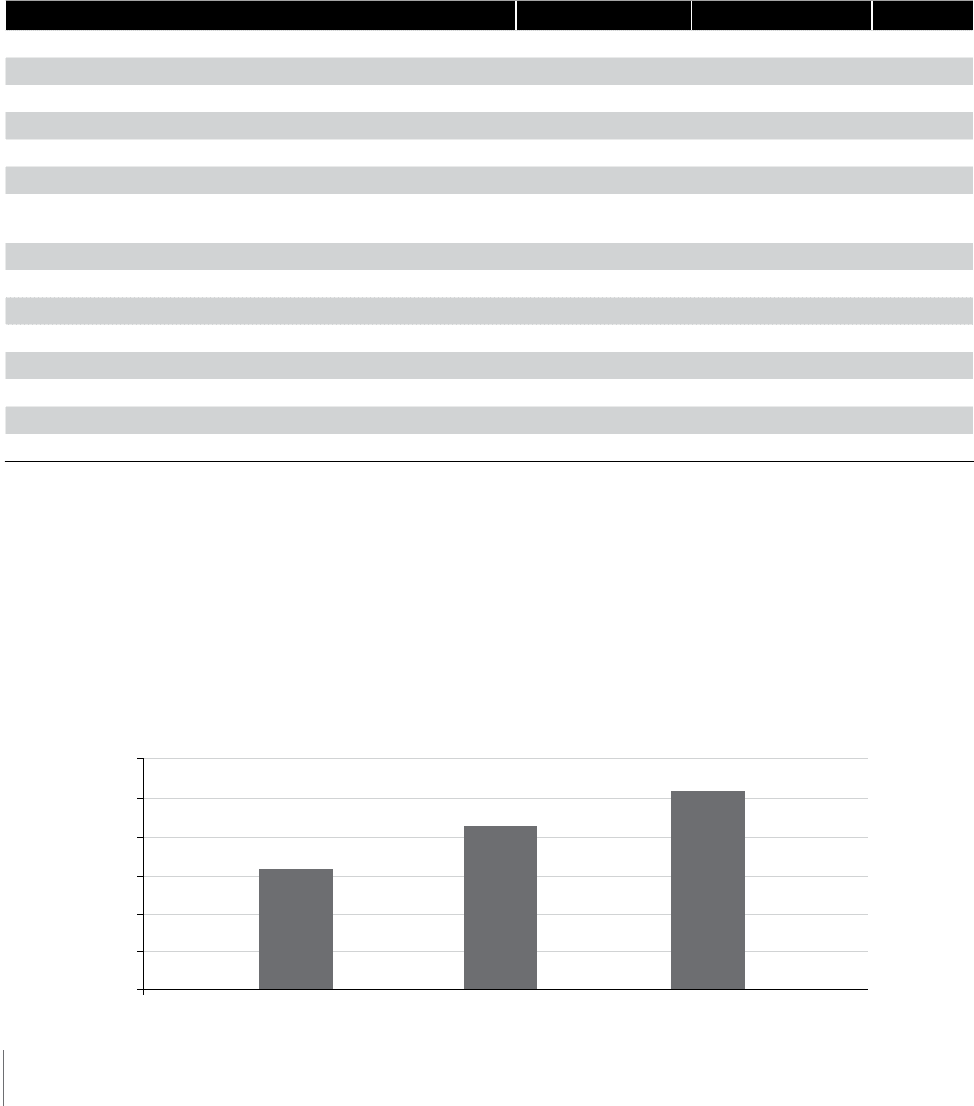
Deposits
The following chart depicts the trends in current and savings account deposits over the last three years.
Management’s Discussion & Analysis
CASA Deposits
` billion
1200.00
1000.00
800.00
600.00
400.00
200.00
March 2009
28.7%
41.7%
45.1%
March 2010 March 2011
60