ICICI Bank 2011 Annual Report Download - page 88
Download and view the complete annual report
Please find page 88 of the 2011 ICICI Bank annual report below. You can navigate through the pages in the report by either clicking on the pages listed below, or by using the keyword search tool below to find specific information within the annual report.-
 1
1 -
2
-
3
-
4
-
5
-
6
-
7
-
8
-
9
-
10
-
11
-
12
-
13
-
14
-
15
-
16
-
17
-
18
-
19
-
20
-
21
-
22
-
23
-
24
-
25
-
26
-
27
-
28
-
29
-
30
-
31
-
32
-
33
-
34
-
35
-
36
-
37
-
38
-
39
-
40
-
41
-
42
-
43
-
44
-
45
-
46
-
47
-
48
-
49
-
50
-
51
-
52
-
53
-
54
-
55
-
56
-
57
-
58
-
59
-
60
-
61
-
62
-
63
-
64
-
65
-
66
-
67
-
68
-
69
-
70
-
71
-
72
-
73
-
74
-
75
-
76
-
77
-
 78
78 -
 79
79 -
 80
80 -
 81
81 -
 82
82 -
 83
83 -
 84
84 -
 85
85 -
 86
86 -
 87
87 -
 88
88 -
 89
89 -
 90
90 -
 91
91 -
 92
92 -
 93
93 -
 94
94 -
 95
95 -
 96
96 -
 97
97 -
 98
98 -
99
-
100
-
101
-
102
-
103
-
104
-
105
-
106
-
107
-
108
-
109
-
110
-
111
-
112
-
113
-
114
-
115
-
116
-
117
-
118
-
119
-
120
-
121
-
122
-
123
-
124
-
125
-
126
-
127
-
128
-
129
-
130
-
131
-
132
-
133
-
134
-
135
-
136
-
137
-
138
-
139
-
140
-
141
-
142
-
143
-
144
-
145
-
146
-
147
-
148
-
149
-
150
-
151
-
152
-
153
-
154
-
155
-
156
-
157
-
158
-
159
-
160
-
161
-
162
-
163
-
164
-
165
-
166
-
167
-
168
-
169
-
170
-
171
-
172
-
173
-
174
-
175
-
176
-
177
-
178
-
179
-
180
-
181
-
182
-
183
-
184
-
185
-
186
-
187
-
188
-
189
-
190
-
191
-
192
-
193
-
194
-
195
-
196
-
197
-
198
-
199
-
200
-
201
-
202
-
203
-
204
 |
 |

F10
At
31.03.2011
At
31.03.2010
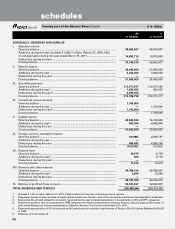
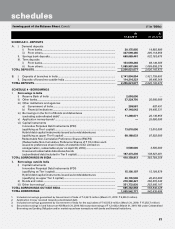
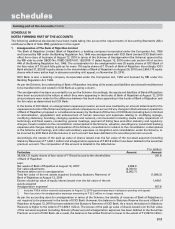
SCHEDULE 10 - FIXED ASSETS
I. Premises
At cost at March 31 of preceding year ..................................................................... 23,122,359 24,110,318
Additions during the year1 ......................................................................................... 15,480,495 777,682
Deductions during the year ....................................................................................... (605,659) (1,765,641)
Depreciation to date .................................................................................................. (5,799,328) (4,781,332)
Net block2 .................................................................................................................... 32,197,867 18,341,027
II. Other fixed assets (including furniture and fixtures)
At cost at March 31 of preceding year ..................................................................... 30,468,293 32,575,569
Additions during the year1 ......................................................................................... 6,048,746 1,599,686
Deductions during the year ....................................................................................... (739,661) (3,706,962)
Depreciation to date .................................................................................................. (23,103,046) (20,216,373)
Net block .................................................................................................................... 12,674,332 10,251,920
III. Assets given on lease
At cost at March 31 of preceding year ..................................................................... 17,550,500 17,751,174
Additions during the year .......................................................................................... ——
Deductions during the year ....................................................................................... (250,413) (200,674)
Depreciation to date, accumulated lease adjustment and provisions .................... (14,729,735) (14,016,548)
Net block ..................................................................................................................... 2,570,352 3,533,952
TOTAL FIXED ASSETS ....................................................................................................... 47,442,551 32,126,899
1. Includes assets acquired from erstwhile The Bank of Rajasthan Limited during the year ended March 31, 2011.
2. Includes assets amounting to Nil (March 31, 2010: ` 446.1 million) which are in the process of being sold.
SCHEDULE 11 - OTHER ASSETS
I. Inter-office adjustments (net) ..................................................................................... 207,829 —
II. Interest accrued .......................................................................................................... 39,216,054 32,528,366
III. Tax paid in advance/tax deducted at source (net) .................................................... 34,885,203 37,793,206
I V. Stationery and stamps ............................................................................................... 109,751 641
V. Non-banking assets acquired in satisfaction of claims1 ........................................... 730,338 674,945
VI. Advances for capital assets ...................................................................................... 1,131,955 11,744,493
VII. Deposits ...................................................................................................................... 11,868,646 17,976,859
VIII. Deferred tax asset (net) .............................................................................................. 26,900,252 20,756,703
IX. Others ......................................................................................................................... 48,424,634 70,674,123
TOTAL OTHER ASSETS ...................................................................................................... 163,474,662 192,149,336
1. Includes certain non-banking assets acquired in satisfaction of claims which are in the process of being transferred in the Bank's name.
SCHEDULE 12 - CONTINGENT LIABILITIES
I. Claims against the Bank not acknowledged as debts .............................................. 17,022,222 33,568,263
II. Liability for partly paid investments .......................................................................... 128,050 128,126
III. Liability on account of outstanding forward exchange contracts1 ........................... 2,468,618,342 1,660,687,240
I V. Guarantees given on behalf of constituents
a) In India ................................................................................................................... 647,336,491 489,280,827
b) Outside India ......................................................................................................... 178,935,843 129,084,608
V. Acceptances, endorsements and other obligations ................................................. 393,340,369 321,224,087
VI. Currency swaps1 ......................................................................................................... 561,284,711 524,786,068
VII. Interest rate swaps,currency options and interest rate futures1 .............................. 4,903,897,090 4,012,141,159
VIII. Other items for which the Bank is contingently liable2 ............................................. 60,653,022 99,940,209
TOTAL CONTINGENT LIABILITIES ................................................................................... 9,231,216,140 7,270,840,587
1. Represents notional amount.
2. Includes an amount of ` 1,653.8 million pertaining to government securities settled after the Balance Sheet date, which are accounted
as per settlement date method pursuant to RBI guidelines issued during the year ended March 31, 2011.
(` in ‘000s)
forming part of the Balance Sheet (Contd.)
schedules