ICICI Bank 2011 Annual Report Download - page 159
Download and view the complete annual report
Please find page 159 of the 2011 ICICI Bank annual report below. You can navigate through the pages in the report by either clicking on the pages listed below, or by using the keyword search tool below to find specific information within the annual report.-
 1
1 -
2
-
3
-
4
-
5
-
6
-
7
-
8
-
9
-
10
-
11
-
12
-
13
-
14
-
15
-
16
-
17
-
18
-
19
-
20
-
21
-
22
-
23
-
24
-
25
-
26
-
27
-
28
-
29
-
30
-
31
-
32
-
33
-
34
-
35
-
36
-
37
-
38
-
39
-
40
-
41
-
42
-
43
-
44
-
45
-
46
-
47
-
48
-
49
-
50
-
51
-
52
-
53
-
54
-
55
-
56
-
57
-
58
-
59
-
60
-
61
-
62
-
63
-
64
-
65
-
66
-
67
-
68
-
69
-
70
-
71
-
72
-
73
-
74
-
75
-
76
-
77
-
78
-
79
-
80
-
81
-
82
-
83
-
84
-
85
-
86
-
87
-
88
-
89
-
90
-
91
-
92
-
93
-
94
-
95
-
96
-
97
-
98
-
99
-
100
-
101
-
102
-
103
-
104
-
105
-
106
-
107
-
108
-
109
-
110
-
111
-
112
-
113
-
114
-
115
-
116
-
117
-
118
-
119
-
120
-
121
-
122
-
123
-
124
-
125
-
126
-
127
-
128
-
129
-
130
-
131
-
132
-
133
-
134
-
135
-
136
-
137
-
138
-
139
-
140
-
141
-
142
-
143
-
144
-
145
-
146
-
147
-
148
-
 149
149 -
 150
150 -
 151
151 -
 152
152 -
 153
153 -
 154
154 -
 155
155 -
 156
156 -
 157
157 -
 158
158 -
 159
159 -
 160
160 -
 161
161 -
 162
162 -
 163
163 -
 164
164 -
 165
165 -
 166
166 -
 167
167 -
 168
168 -
 169
169 -
170
-
171
-
172
-
173
-
174
-
175
-
176
-
177
-
178
-
179
-
180
-
181
-
182
-
183
-
184
-
185
-
186
-
187
-
188
-
189
-
190
-
191
-
192
-
193
-
194
-
195
-
196
-
197
-
198
-
199
-
200
-
201
-
202
-
203
-
204
 |
 |

F81
forming part of the Consolidated Accounts (Contd.)
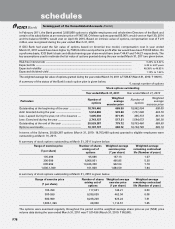
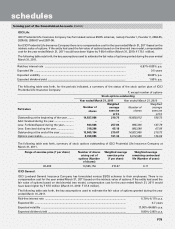
6.2 Assets under finance lease
The following table sets forth, for the periods indicated, the details of finance leases.
Particulars At
March 31, 2011
At
March 31, 2010
Future minimum lease receipts ......................................................................... 1,437.1 1,651.9
Present value of lease receipts .......................................................................... 6.8 17.4
Unmatured finance charges ............................................................................... 0.6 0.2
Total .................................................................................................................. 7.4 17.6
Maturity profile of future minimum lease receipts
- Not later than one year .................................................................................. 2.7 17.6
- Later than one year and not later than five years ......................................... 4.7 –
- Later than five years ....................................................................................... ––
Total .................................................................................................................. 7.4 17.6
` in million
6.3 Maturity profile of present value of lease rentals
The following table sets forth, for the periods indicated, the details of maturity profile of present value of finance lease receipts.
Particulars At
March 31, 2011
At
March 31, 2010
Not later than one year ............................................................................................... 2.4 17.4
Later than one year and not later than five years ...................................................... 4.4 –
Later than five years .................................................................................................... – –
Total ............................................................................................................................. 6.8 17.4
` in million
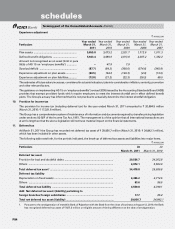
7. Preference shares
Certain government securities amounting to ` 2,563.8 million at March 31, 2011 (March 31, 2010: ` 2,405.2 million) have
been earmarked against redemption of preference share issued by the Bank, which fall due for redemption on April 20,
2018, as per the original issue terms.
8. Provisions and contingencies
The following table sets forth, for the periods indicated, the break-up of provisions and contingencies included in profit
and loss account.
Particulars Year ended
March 31, 2011
Year ended
March 31, 2010
Provision for depreciation of investments ................................................................. 3,162.7 328.2
Provision towards non-performing and other assets ................................................ 20,555.3 44,745.4
Provision towards income tax1 ................................................................................... 20,684.9 17,321.8
Provision towards wealth tax ...................................................................................... 30.2 30.5
Other provision and contingencies ............................................................................ 1,881.8 513.4
Total provisions and contingencies ........................................................................... 46,314.9 62,939.3
` in million
1. Net of creation of net deferred tax asset amounting to ` 4,441.6 million for the year ended March 31, 2011 (March 31, 2010: ` 2,349.8 million).
schedules