ICICI Bank 2011 Annual Report Download - page 118
Download and view the complete annual report
Please find page 118 of the 2011 ICICI Bank annual report below. You can navigate through the pages in the report by either clicking on the pages listed below, or by using the keyword search tool below to find specific information within the annual report.-
 1
1 -
2
-
3
-
4
-
5
-
6
-
7
-
8
-
9
-
10
-
11
-
12
-
13
-
14
-
15
-
16
-
17
-
18
-
19
-
20
-
21
-
22
-
23
-
24
-
25
-
26
-
27
-
28
-
29
-
30
-
31
-
32
-
33
-
34
-
35
-
36
-
37
-
38
-
39
-
40
-
41
-
42
-
43
-
44
-
45
-
46
-
47
-
48
-
49
-
50
-
51
-
52
-
53
-
54
-
55
-
56
-
57
-
58
-
59
-
60
-
61
-
62
-
63
-
64
-
65
-
66
-
67
-
68
-
69
-
70
-
71
-
72
-
73
-
74
-
75
-
76
-
77
-
78
-
79
-
80
-
81
-
82
-
83
-
84
-
85
-
86
-
87
-
88
-
89
-
90
-
91
-
92
-
93
-
94
-
95
-
96
-
97
-
98
-
99
-
100
-
101
-
102
-
103
-
104
-
105
-
106
-
107
-
 108
108 -
 109
109 -
 110
110 -
 111
111 -
 112
112 -
 113
113 -
 114
114 -
 115
115 -
 116
116 -
 117
117 -
 118
118 -
 119
119 -
 120
120 -
 121
121 -
 122
122 -
 123
123 -
 124
124 -
 125
125 -
 126
126 -
 127
127 -
 128
128 -
129
-
130
-
131
-
132
-
133
-
134
-
135
-
136
-
137
-
138
-
139
-
140
-
141
-
142
-
143
-
144
-
145
-
146
-
147
-
148
-
149
-
150
-
151
-
152
-
153
-
154
-
155
-
156
-
157
-
158
-
159
-
160
-
161
-
162
-
163
-
164
-
165
-
166
-
167
-
168
-
169
-
170
-
171
-
172
-
173
-
174
-
175
-
176
-
177
-
178
-
179
-
180
-
181
-
182
-
183
-
184
-
185
-
186
-
187
-
188
-
189
-
190
-
191
-
192
-
193
-
194
-
195
-
196
-
197
-
198
-
199
-
200
-
201
-
202
-
203
-
204
 |
 |

F40
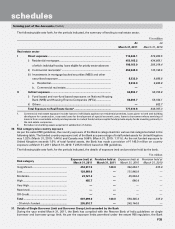
Experience adjustment
` in million
Particulars
Year ended
March 31,
2011
Year ended
March 31,
2010
Year ended
March 31,
2009
Year ended
March 31,
2008
Year ended
March 31,
2007
Plan assets .............................................................. 5,182.4 2,507.5 2,272.1 1,506.7 891.7
Defined benefit obligations .................................... 5,082.7 2,310.5 2,195.7 1,840.4 1,142.1
Amount not recognised as an asset
(limit in para 59(b)) ................................................. —47.9 7.9 — —
Surplus/(deficit) ...................................................... 99.7 149.1 68.5 (333.7) (250.4)
Experience adjustment on plan assets .................. (63.2) 168.8 (118.0) (24.8) (18.0)
Experience adjustment on plan liabilities .............. 79.0 (0.8) (4.1) 14.0 38.1
The estimates of future salary increases, considered in actuarial valuation, take into consideration inflation, seniority,
promotion and other relevant factors.
The guidance on implementing Accounting Standard 15 - Employee Benefits (revised 2005) issued by the Accounting
Standards Board (ASB) provides that exempt provident funds which require employers to meet the interest shortfall
are in effect defined benefit plans. The Bank’s actuary has informed that it is not practicable to actuarially determine the
interest shortfall obligation.
39. Movement in provision for credit card/debit card reward points
The following table sets forth, for the periods indicated, movement in provision for credit card/debit card reward points.
` in million
Year ended
March 31, 2011
Year ended
March 31, 2010
Opening provision for reward points ................................................................. 269.7 232.0
Provision for reward points made during the year ............................................ 555.4 476.0
Utilisation/write-back of provision for reward points ........................................ (362.6) (438.3)
Closing provision for reward points1 ................................................................. 462.5 269.7
1. The closing provision is based on the actuarial valuation of accumulated credit/debit card reward points. This amount will be
utilised towards redemption of the credit/debit card reward points.
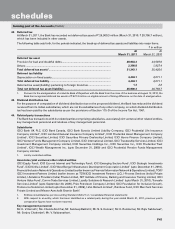
40. Provisions and contingencies
The following table sets forth, for the periods indicated, the break-up of provisions and contingencies included in profit
and loss account.
` in million
Year ended
March 31, 2011
Year ended
March 31, 2010
Provisions for depreciation of investments ....................................................... 2,038.2 (26.5)
Provision towards non-performing and other assets ........................................ 19,769.1 43,621.6
Provision towards standard assets ..................................................................... ——
Provision towards income tax1 ........................................................................... 16,063.3 13,173.4
Provision towards wealth tax .............................................................................. 30.0 30.0
Other provisions and contingencies................................................................... 1,061.1 273.5
Total provisions and contingencies ................................................................... 38,961.7 57,072.0
1. Net of creation of net deferred tax asset amounting to ` 5,317.8 million for the year ended March 31, 2011 (March 31, 2010:
` 2,804.4 million).
41. Provision for income tax
The provision for income tax (including deferred tax) for the year ended March 31, 2011 amounted to ` 16,063.3 million
(March 31, 2010: ` 13,173.4 million).
The Bank has a comprehensive system of maintenance of information and documents required by transfer pricing
legislation under section 92-92F of the Income Tax Act, 1961. The Bank is of the opinion that all international transactions
are at arm’s length so that the above legislation will not have material impact on the financial statements.
forming part of the Accounts (Contd.)
schedules