ICICI Bank 2011 Annual Report Download - page 58
Download and view the complete annual report
Please find page 58 of the 2011 ICICI Bank annual report below. You can navigate through the pages in the report by either clicking on the pages listed below, or by using the keyword search tool below to find specific information within the annual report.-
 1
1 -
2
-
3
-
4
-
5
-
6
-
7
-
8
-
9
-
10
-
11
-
12
-
13
-
14
-
15
-
16
-
17
-
18
-
19
-
20
-
21
-
22
-
23
-
24
-
25
-
26
-
27
-
28
-
29
-
30
-
31
-
32
-
33
-
34
-
35
-
36
-
37
-
38
-
39
-
40
-
41
-
42
-
43
-
44
-
45
-
46
-
47
-
 48
48 -
 49
49 -
 50
50 -
 51
51 -
 52
52 -
 53
53 -
 54
54 -
 55
55 -
 56
56 -
 57
57 -
 58
58 -
 59
59 -
 60
60 -
 61
61 -
 62
62 -
 63
63 -
 64
64 -
 65
65 -
 66
66 -
 67
67 -
 68
68 -
69
-
70
-
71
-
72
-
73
-
74
-
75
-
76
-
77
-
78
-
79
-
80
-
81
-
82
-
83
-
84
-
85
-
86
-
87
-
88
-
89
-
90
-
91
-
92
-
93
-
94
-
95
-
96
-
97
-
98
-
99
-
100
-
101
-
102
-
103
-
104
-
105
-
106
-
107
-
108
-
109
-
110
-
111
-
112
-
113
-
114
-
115
-
116
-
117
-
118
-
119
-
120
-
121
-
122
-
123
-
124
-
125
-
126
-
127
-
128
-
129
-
130
-
131
-
132
-
133
-
134
-
135
-
136
-
137
-
138
-
139
-
140
-
141
-
142
-
143
-
144
-
145
-
146
-
147
-
148
-
149
-
150
-
151
-
152
-
153
-
154
-
155
-
156
-
157
-
158
-
159
-
160
-
161
-
162
-
163
-
164
-
165
-
166
-
167
-
168
-
169
-
170
-
171
-
172
-
173
-
174
-
175
-
176
-
177
-
178
-
179
-
180
-
181
-
182
-
183
-
184
-
185
-
186
-
187
-
188
-
189
-
190
-
191
-
192
-
193
-
194
-
195
-
196
-
197
-
198
-
199
-
200
-
201
-
202
-
203
-
204
 |
 |

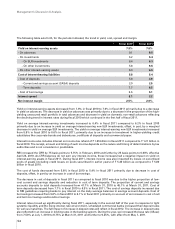
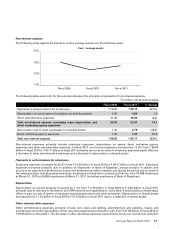
Non-interest income primarily includes fee and commission income, income from treasury-related activities and lease
and other income. During fiscal 2011, the decrease in non-interest income was primarily on account of a decrease in
income from treasury-related activities. During fiscal 2011, there was an increase in fee income and income by way of
dividends included in lease and other income. Overall there was a net decrease in non-interest income by 11.1% from
` 74.78 billion in fiscal 2010 to ` 66.48 billion in fiscal 2011.
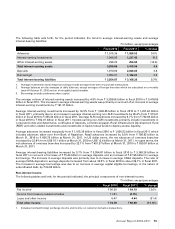
Fee income
Fee income primarily includes fees from corporate clients such as loan processing fees, transaction banking fees and
structuring fees and fees from retail customers such as loan processing fees, fees from credit cards business, account
service charges and third party referral fees. Fee income increased from ` 56.50 billion in fiscal 2010 to ` 64.19 billion
in fiscal 2011 primarily due to an increase in corporate fees, offset, in part, by decline in retail fees. Higher credit
demand and increased business activity in the corporate sector due to economic recovery resulted in an increase in
loan processing fees and transaction banking related fees from corporate clients.
Income from foreign exchange transactions with clients and from margins on derivatives transactions with clients
increased by 17.3% from ` 6.78 billion in fiscal 2010 to ` 7.95 billion in fiscal 2011.
Profit/(loss) on treasury-related activities (net)
Income from treasury-related activities includes income from sale of investments and revaluation of investments
on account of changes in unrealised profit/(loss) in the fixed income, equity and preference share portfolio, units of
venture funds and security receipts.
Profit on treasury-related activities decreased from a gain of ` 11.81 billion in fiscal 2010 to a loss of ` 2.15 billion in
fiscal 2011. Treasury income for fiscal 2011 primarily includes loss on investments in government of India securities
and loss on security receipts, offset, in part, by gains on equity investments. The higher income from treasury-related
activities in fiscal 2010 included reversal of provision against credit derivatives due to softening of credit spreads,
higher profit on government of India securities and other fixed income instruments and in equity investments offset,
in part, by a loss on mark-to-market/realised loss on security receipts.
During fiscal 2010, we had capitalised on certain market opportunities to realise gains from sale of our government
and other domestic fixed income positions. During fiscal 2011, the government securities portfolio was impacted by
increase in interest rates which resulted in a loss for fiscal 2011 as compared to gains in fiscal 2010.
The equity markets remained volatile due to global and domestic developments including the political unrest in the
Middle East and concerns on global recovery due to possible impact on crude oil prices, and continued high levels of
inflation in India and resultant monetary tightening. These factors impacted market sentiment resulting in decline in
realised/unrealised profit on equity investments for fiscal 2011 as compared to fiscal 2010.
During fiscal 2010, softening of credit spreads had resulted in reversal of provision held against the credit derivatives
portfolio amounting to ` 3.97 billion. During fiscal 2011, there was a profit on credit derivatives portfolio amounting
to ` 0.15 billion.
At March 31, 2011, we had an outstanding net investment of ` 28.31 billion in security receipts issued by asset
reconstruction companies in relation to sale of non-performing assets. At the end of each reporting period, security
receipts issued by asset reconstruction companies are valued as per net asset value obtained from the asset
reconstruction company from time to time. During fiscal 2011, the impact of these security receipts on the income
from treasury-related activities was a loss of ` 2.31 billion compared to a loss of ` 2.12 billion in fiscal 2010.
Lease and other income
Lease and other income primarily includes dividend from subsidiaries, lease rentals and profit on sale of fixed assets.
Lease and other income decreased from ` 6.47 billion in fiscal 2010 to ` 4.44 billion in fiscal 2011. During fiscal 2010, the
Bank and First Data, a global leader in electronic commerce and payment services, formed a merchant acquiring alliance
and a new entity, 81.0% owned by First Data. This entity acquired ICICI Bank’s merchant acquiring operations through
transfer of assets, primarily comprising fixed assets, receivables and payables, and assumption of liabilities, for a total
consideration of ` 3.74 billion. We realised a profit of ` 2.03 billion from this transaction in fiscal 2010.
Management’s Discussion & Analysis
56