ICICI Bank 2011 Annual Report Download - page 152
Download and view the complete annual report
Please find page 152 of the 2011 ICICI Bank annual report below. You can navigate through the pages in the report by either clicking on the pages listed below, or by using the keyword search tool below to find specific information within the annual report.-
 1
1 -
2
-
3
-
4
-
5
-
6
-
7
-
8
-
9
-
10
-
11
-
12
-
13
-
14
-
15
-
16
-
17
-
18
-
19
-
20
-
21
-
22
-
23
-
24
-
25
-
26
-
27
-
28
-
29
-
30
-
31
-
32
-
33
-
34
-
35
-
36
-
37
-
38
-
39
-
40
-
41
-
42
-
43
-
44
-
45
-
46
-
47
-
48
-
49
-
50
-
51
-
52
-
53
-
54
-
55
-
56
-
57
-
58
-
59
-
60
-
61
-
62
-
63
-
64
-
65
-
66
-
67
-
68
-
69
-
70
-
71
-
72
-
73
-
74
-
75
-
76
-
77
-
78
-
79
-
80
-
81
-
82
-
83
-
84
-
85
-
86
-
87
-
88
-
89
-
90
-
91
-
92
-
93
-
94
-
95
-
96
-
97
-
98
-
99
-
100
-
101
-
102
-
103
-
104
-
105
-
106
-
107
-
108
-
109
-
110
-
111
-
112
-
113
-
114
-
115
-
116
-
117
-
118
-
119
-
120
-
121
-
122
-
123
-
124
-
125
-
126
-
127
-
128
-
129
-
130
-
131
-
132
-
133
-
134
-
135
-
136
-
137
-
138
-
139
-
140
-
141
-
 142
142 -
 143
143 -
 144
144 -
 145
145 -
 146
146 -
 147
147 -
 148
148 -
 149
149 -
 150
150 -
 151
151 -
 152
152 -
 153
153 -
 154
154 -
 155
155 -
 156
156 -
 157
157 -
 158
158 -
 159
159 -
 160
160 -
 161
161 -
 162
162 -
163
-
164
-
165
-
166
-
167
-
168
-
169
-
170
-
171
-
172
-
173
-
174
-
175
-
176
-
177
-
178
-
179
-
180
-
181
-
182
-
183
-
184
-
185
-
186
-
187
-
188
-
189
-
190
-
191
-
192
-
193
-
194
-
195
-
196
-
197
-
198
-
199
-
200
-
201
-
202
-
203
-
204
 |
 |

F74
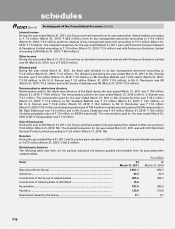
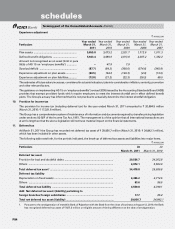
2. Earnings per share (EPS)
Basic and diluted earnings per equity share are computed in accordance with AS 20 on ‘earnings per share’. Basic
earnings per share is computed by dividing net profit after tax by the weighted average number of equity shares
outstanding during the year. The diluted earnings per equity share is computed using the weighted average number of
equity shares and dilutive potential equity shares outstanding during the year.
The following table sets forth, for the periods indicated, the computation of earnings per share.
The dilutive impact is mainly due to options granted to employees by the Group.
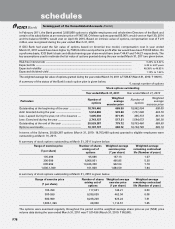
3. Related party transactions
The Group has transactions with its related parties comprising associates/other related entities and key management personnel
and their relatives.
Associates/other related entities
Financial Inclusion Network & Operations Limited (earlier known as Financial Information Network & Operations Limited),
I-Process Services (India) Private Limited, I-Solutions Providers (India) Private Limited, NIIT Institute of Finance Banking and
Insurance Training Limited, Comm Trade Services Limited, Prize Petroleum Company Limited, ICICI Foundation for Inclusive
Growth, Rainbow Fund, Firstsource Solutions Limited (up to December 31, 2009), ICICI Merchant Services Private Limited and
Mewar Aanchalik Gramin Bank1.
1. With respect to a entity, which has been identified as a related party during the year ended March 31, 2011, previous year’s comparative
figures have not been reported.
Key management personnel
Mr. K. V. Kamath1, Ms. Chanda Kochhar, Mr. Sandeep Bakhshi2, Mr. N. S. Kannan3, Mr. K. Ramkumar, Mr. Rajiv Sabharwal4,
Mr. Sonjoy Chatterjee5, Mr. V. Vaidyanathan1.
Relatives of key management personnel
Ms. Rajalakshmi Kamath1, Mr. Ajay Kamath1, Ms. Ajnya Pai1, Mr. Mohan Kamath1, Mr. Deepak Kochhar, Mr. Arjun Kochhar,
Ms. Aarti Kochhar, Mr. Mahesh Advani, Ms. Varuna Karna, Ms. Sunita R. Advani, Ms. Mona Bakhshi2, Mr. Sameer
Bakhshi2, Ms. Rangarajan Kumudalakshmi3, Ms. Aditi Kannan3, Mr. Narayanan Raghunathan3, Mr. Narayanan Rangarajan3,
Mr. Narayanan Krishnamachari3, Ms. Narayanan Sudha3, Mr. R. Shyam, Ms. R. Suchithra, Mr. K. Jayakumar, Ms. J. Krishnaswamy,
Ms. Sangeeta Sabharwal4, Mr. Somnath Chatterjee5, Mr. Tarak Nath Chatterjee5, Ms. Sunaina Chatterjee5, Ms. Nandini Chatterjee5,
Ms. Jeyashree V.1, Mr. V. Satyamurthy1, Mr. V. Krishnamurthy1, Mr. K. Vembu1.
1. Transactions reported upto April 30, 2009.
2. Transactions reported with effect from May 1, 2009 upto July 31, 2010.
3. Transactions reported with effect from May 1, 2009.
4. Transactions reported with effect from June 24, 2010.
5. Transactions reported upto April 30, 2010.
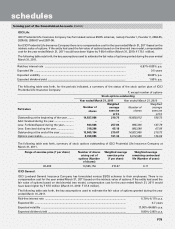
The following were the significant transactions between the Group and its related parties for the year ended March 31,
2011. A specific related party transaction is disclosed as a material related party transaction wherever it exceeds 10% of
all related party transactions in that category.
Year ended
March 31, 2011
Year ended
March 31, 2010
Basic
Weighted average no. of equity shares outstanding ......................................... 1,137,988,639 1,113,737,557
Net profit .............................................................................................................. 60,932.7 46,702.9
Basic earnings per share (`) ................................................................................ 53.54 41.93
Diluted .................................................................................................................
Weighted average no. of equity shares outstanding ......................................... 1,143,267,823 1,118,224,665
Net profit .............................................................................................................. 60,876.5 46,649.4
Diluted earnings per share (`) ............................................................................. 53.25 41.72
Nominal value per share (`) ................................................................................ 10.00 10.00
` in million, except per share data
forming part of the Consolidated Accounts (Contd.)
schedules