ICICI Bank 2011 Annual Report Download - page 183
Download and view the complete annual report
Please find page 183 of the 2011 ICICI Bank annual report below. You can navigate through the pages in the report by either clicking on the pages listed below, or by using the keyword search tool below to find specific information within the annual report.-
 1
1 -
2
-
3
-
4
-
5
-
6
-
7
-
8
-
9
-
10
-
11
-
12
-
13
-
14
-
15
-
16
-
17
-
18
-
19
-
20
-
21
-
22
-
23
-
24
-
25
-
26
-
27
-
28
-
29
-
30
-
31
-
32
-
33
-
34
-
35
-
36
-
37
-
38
-
39
-
40
-
41
-
42
-
43
-
44
-
45
-
46
-
47
-
48
-
49
-
50
-
51
-
52
-
53
-
54
-
55
-
56
-
57
-
58
-
59
-
60
-
61
-
62
-
63
-
64
-
65
-
66
-
67
-
68
-
69
-
70
-
71
-
72
-
73
-
74
-
75
-
76
-
77
-
78
-
79
-
80
-
81
-
82
-
83
-
84
-
85
-
86
-
87
-
88
-
89
-
90
-
91
-
92
-
93
-
94
-
95
-
96
-
97
-
98
-
99
-
100
-
101
-
102
-
103
-
104
-
105
-
106
-
107
-
108
-
109
-
110
-
111
-
112
-
113
-
114
-
115
-
116
-
117
-
118
-
119
-
120
-
121
-
122
-
123
-
124
-
125
-
126
-
127
-
128
-
129
-
130
-
131
-
132
-
133
-
134
-
135
-
136
-
137
-
138
-
139
-
140
-
141
-
142
-
143
-
144
-
145
-
146
-
147
-
148
-
149
-
150
-
151
-
152
-
153
-
154
-
155
-
156
-
157
-
158
-
159
-
160
-
161
-
162
-
163
-
164
-
165
-
166
-
167
-
168
-
169
-
170
-
171
-
172
-
 173
173 -
 174
174 -
 175
175 -
 176
176 -
 177
177 -
 178
178 -
 179
179 -
 180
180 -
 181
181 -
 182
182 -
 183
183 -
 184
184 -
 185
185 -
 186
186 -
 187
187 -
 188
188 -
 189
189 -
 190
190 -
 191
191 -
 192
192 -
 193
193 -
194
-
195
-
196
-
197
-
198
-
199
-
200
-
201
-
202
-
203
-
204
 |
 |
F105
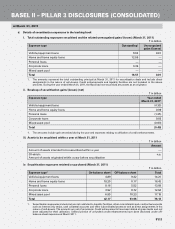
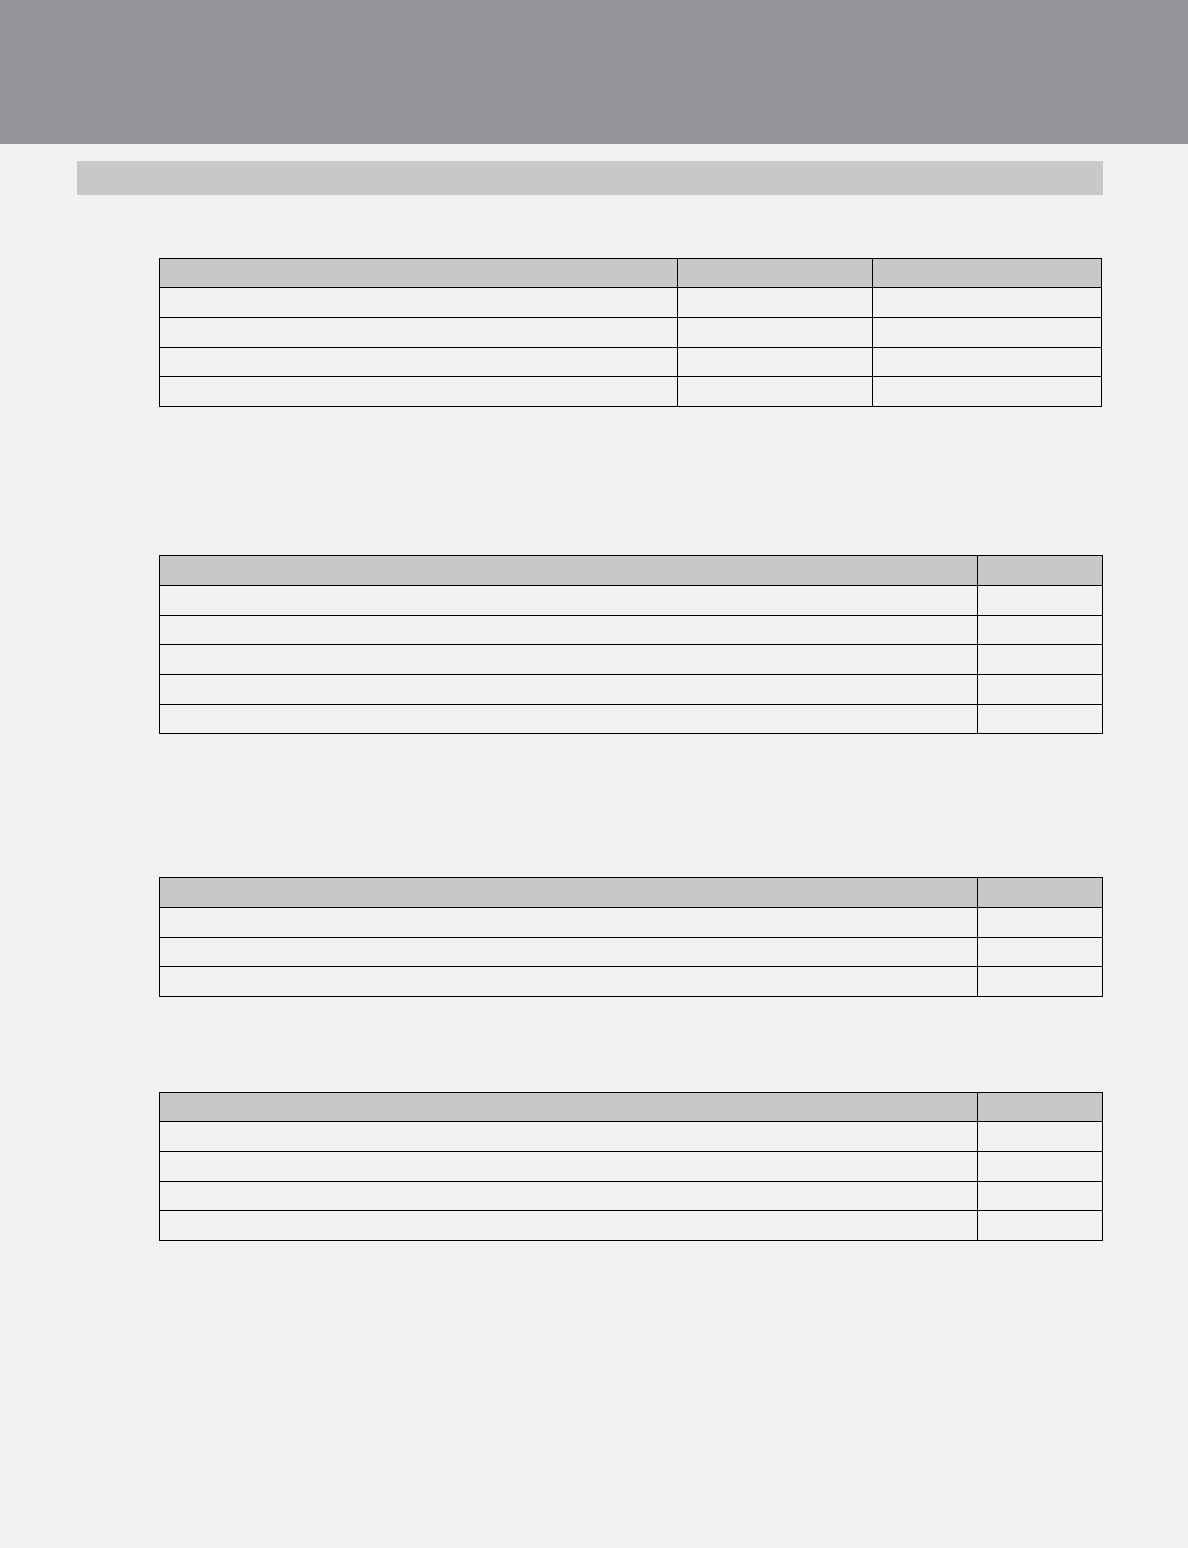
f. Movement of NPLs
` in billion
Gross NPL Net NPL
Opening balance at April 1, 2010 100.75 42.84
Additions during the year132.00 7.52
Reductions/write-offs during the year1(25.53) (21.45)
Closing balance at March 31, 20112107.22 28.91
1. The difference between the opening and closing balances (other than accounts written off during the year) of NPLs in
credit cards is included in additions during the year.
2. Includes advances portfolio of the Bank and its banking subsidiaries and ICICI Home Finance Company.
g. Movement of provisions for NPLs
` in billion
Amount
Opening balance at April 1, 2010 57.90
Provisions made during the year128.59
Write-offs during the year (1.36)
Write-back of excess provisions during the year (6.82)
Closing balance at March 31, 2011278.31
1 The difference between the opening and closing balances (other than accounts written off during the year) of provisions
on credit cards is included in provisions made during the year.
2 Includes advances portfolio of the Bank and its banking subsidiaries and ICICI Home Finance Company.
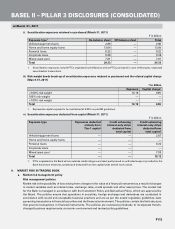
h. Amount of non-performing investments (NPIs) in securities, other than government and other approved securities
` in billion
Amount1
Gross NPIs at March 31, 2011 5.61
Total provisions held on NPIs (4.37)
Net NPIs at March 31, 2011 1.24
1. Includes NPIs of the Bank and its banking subsidiaries.
i. Movement of provisions for depreciation on investments1
` in billion
Amount
Opening balance at April 1, 2010 18.72
Provision/depreciation (net) made during the year 11.78
(Write-off)/(write back) of excess provision during the year (2.28)
Closing balance at March 31, 2011228.22
1. After considering movement in appreciation on investments.
2. Includes all entities considered for Basel II capital adequacy computation.
BASEL II – PILLAR 3 DISCLOSURES (CONSOLIDATED)
at March 31, 2011