ICICI Bank 2011 Annual Report Download - page 158
Download and view the complete annual report
Please find page 158 of the 2011 ICICI Bank annual report below. You can navigate through the pages in the report by either clicking on the pages listed below, or by using the keyword search tool below to find specific information within the annual report.-
 1
1 -
2
-
3
-
4
-
5
-
6
-
7
-
8
-
9
-
10
-
11
-
12
-
13
-
14
-
15
-
16
-
17
-
18
-
19
-
20
-
21
-
22
-
23
-
24
-
25
-
26
-
27
-
28
-
29
-
30
-
31
-
32
-
33
-
34
-
35
-
36
-
37
-
38
-
39
-
40
-
41
-
42
-
43
-
44
-
45
-
46
-
47
-
48
-
49
-
50
-
51
-
52
-
53
-
54
-
55
-
56
-
57
-
58
-
59
-
60
-
61
-
62
-
63
-
64
-
65
-
66
-
67
-
68
-
69
-
70
-
71
-
72
-
73
-
74
-
75
-
76
-
77
-
78
-
79
-
80
-
81
-
82
-
83
-
84
-
85
-
86
-
87
-
88
-
89
-
90
-
91
-
92
-
93
-
94
-
95
-
96
-
97
-
98
-
99
-
100
-
101
-
102
-
103
-
104
-
105
-
106
-
107
-
108
-
109
-
110
-
111
-
112
-
113
-
114
-
115
-
116
-
117
-
118
-
119
-
120
-
121
-
122
-
123
-
124
-
125
-
126
-
127
-
128
-
129
-
130
-
131
-
132
-
133
-
134
-
135
-
136
-
137
-
138
-
139
-
140
-
141
-
142
-
143
-
144
-
145
-
146
-
147
-
 148
148 -
 149
149 -
 150
150 -
 151
151 -
 152
152 -
 153
153 -
 154
154 -
 155
155 -
 156
156 -
 157
157 -
 158
158 -
 159
159 -
 160
160 -
 161
161 -
 162
162 -
 163
163 -
 164
164 -
 165
165 -
 166
166 -
 167
167 -
 168
168 -
169
-
170
-
171
-
172
-
173
-
174
-
175
-
176
-
177
-
178
-
179
-
180
-
181
-
182
-
183
-
184
-
185
-
186
-
187
-
188
-
189
-
190
-
191
-
192
-
193
-
194
-
195
-
196
-
197
-
198
-
199
-
200
-
201
-
202
-
203
-
204
 |
 |

F80
forming part of the Consolidated Accounts (Contd.)
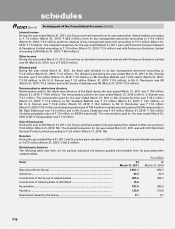
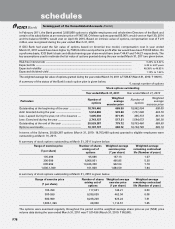
The following table sets forth, for the periods indicated, a summary of the status of the stock option plan of ICICI
Lombard General Insurance Company.
Stock options outstanding
Year ended March 31, 2011 Year ended March 31, 2010
Particulars Number of
options
Weighted
average
exercise
price
Number of
shares
Weighted
average
exercise price
Outstanding at the beginning of the year ........ 13,346,000 94.55 14,399,000 94.19
Add: Granted during the year ........................... 2,312,000 114.00 1,249,000 91.00
Less: Forfeited/ lapsed during the year ............ 1,132,000 126.62 1,705,000 107.33
Less: Exercised during the year ....................... 881,000 43.17 597,000 41.86
Outstanding at the end of the year ................... 13,645,000 98.72 13,346,000 94.56
Options exercisable ........................................... 7,577,000 75.09 6,737,000 63.26
`, except number of options
The following table sets forth, summary of stock options outstanding of ICICI Lombard General Insurance Company at
March 31, 2011.
Range of exercise price (` per share) Number of shares
arising out of
options (Number
of shares)
Weighted average
exercise price
(` per share)
Weighted average
remaining contractual
life (Number of years)
35–200 13,645,000 98.72 7.12
If the Group had used the fair value of options based on the binomial tree model, the compensation cost for the year
ended March 31, 2011 would have been higher by ` 1,022.6 million (March 31, 2010: ` 1,058.3 million) and the proforma
consolidated profit after tax would have been ` 59.91 billion (March 31, 2010: ` 45.64 billion). On a proforma basis, the
Group’s basic earnings per share would have been ` 52.65 (March 31, 2010: ` 40.98) and diluted earnings per share
would have been ` 52.35 (March 31, 2010: ` 40.77).
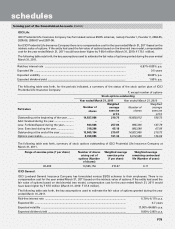
1. Includes impact of acquisition of erstwhile Bank of Rajasthan.
5. Fixed assets
The following table sets forth, for the periods indicated, the movement in software acquired by the Group, as included
in fixed assets.
Particulars At
March 31, 2011
At
March 31, 2010
At cost at March 31 of preceding year ............................................................... 8,014.6 6,906.7
Additions during the year1 ................................................................................... 1,185.5 1,369.5
Deductions during the year ................................................................................ (205.2) (261.6)
Depreciation to date ............................................................................................ (6,245.3) (5,250.7)
Net block .............................................................................................................. 2,749.6 2,763.9
` in million
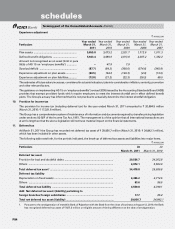
6. Assets on lease
6.1 Assets taken under operating lease
The following table sets forth, for the periods indicated, the details of future rentals payable on operating leases.
Particulars At
March 31, 2011
At
March 31, 2010
Not later than one year ....................................................................................... 1,437.1 1,651.9
Later than one year and not later than five years .............................................. 3,733.4 4,211.4
Later than five years ............................................................................................ 1,265.2 1,500.6
Total ..................................................................................................................... 6,435.7 7,363.9
` in million
schedules