ICICI Bank 2011 Annual Report Download - page 63
Download and view the complete annual report
Please find page 63 of the 2011 ICICI Bank annual report below. You can navigate through the pages in the report by either clicking on the pages listed below, or by using the keyword search tool below to find specific information within the annual report.-
 1
1 -
2
-
3
-
4
-
5
-
6
-
7
-
8
-
9
-
10
-
11
-
12
-
13
-
14
-
15
-
16
-
17
-
18
-
19
-
20
-
21
-
22
-
23
-
24
-
25
-
26
-
27
-
28
-
29
-
30
-
31
-
32
-
33
-
34
-
35
-
36
-
37
-
38
-
39
-
40
-
41
-
42
-
43
-
44
-
45
-
46
-
47
-
48
-
49
-
50
-
51
-
52
-
 53
53 -
 54
54 -
 55
55 -
 56
56 -
 57
57 -
 58
58 -
 59
59 -
 60
60 -
 61
61 -
 62
62 -
 63
63 -
 64
64 -
 65
65 -
 66
66 -
 67
67 -
 68
68 -
 69
69 -
 70
70 -
 71
71 -
 72
72 -
 73
73 -
74
-
75
-
76
-
77
-
78
-
79
-
80
-
81
-
82
-
83
-
84
-
85
-
86
-
87
-
88
-
89
-
90
-
91
-
92
-
93
-
94
-
95
-
96
-
97
-
98
-
99
-
100
-
101
-
102
-
103
-
104
-
105
-
106
-
107
-
108
-
109
-
110
-
111
-
112
-
113
-
114
-
115
-
116
-
117
-
118
-
119
-
120
-
121
-
122
-
123
-
124
-
125
-
126
-
127
-
128
-
129
-
130
-
131
-
132
-
133
-
134
-
135
-
136
-
137
-
138
-
139
-
140
-
141
-
142
-
143
-
144
-
145
-
146
-
147
-
148
-
149
-
150
-
151
-
152
-
153
-
154
-
155
-
156
-
157
-
158
-
159
-
160
-
161
-
162
-
163
-
164
-
165
-
166
-
167
-
168
-
169
-
170
-
171
-
172
-
173
-
174
-
175
-
176
-
177
-
178
-
179
-
180
-
181
-
182
-
183
-
184
-
185
-
186
-
187
-
188
-
189
-
190
-
191
-
192
-
193
-
194
-
195
-
196
-
197
-
198
-
199
-
200
-
201
-
202
-
203
-
204
 |
 |

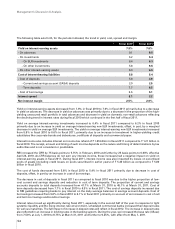
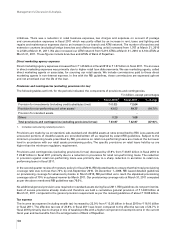
Deposits increased by 11.7% from ` 2,020.17 billion at March 31, 2010 to ` 2,256.02 billion at March 31, 2011
(including ` 134.83 billion of Bank of Rajasthan at August 12, 2010). Term deposits increased from ` 1,178.01 billion
at March 31, 2010 to ` 1,239.55 billion at March 31, 2011 (including ` 88.02 billion of Bank of Rajasthan at August 12,
2010), while savings deposits increased from ` 532.18 billion at March 31, 2010 to ` 668.69 billion at March 31, 2011
(including ` 34.48 billion of Bank of Rajasthan at August 12, 2010) and current deposits increased from ` 309.98 billion at
March 31, 2010 to ` 347.78 billion at March 31, 2011 (including ` 12.32 billion of Bank of Rajasthan at August 12,
2010). Total deposits at March 31, 2011 formed 67.4% of the funding (i.e. deposits and borrowings, other
than preference share capital). During fiscal 2010 and fiscal 2011, we focussed on our strategy of increasing
the share of current and savings account deposits in total deposits and re-balancing our funding mix. The
current and savings account deposits increased from ` 842.16 billion at March 31, 2010 to ` 1,016.47 billion at
March 31, 2011 (including ` 46.80 billion of Bank of Rajasthan at August 12, 2010) and the ratio of current and
savings account deposits to total deposits increased from 41.7% at March 31, 2010 to 45.1% at March 31, 2011.
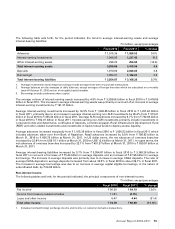
Borrowings (including sub-ordinated debt and preference share capital)
Borrowings increased by 16.2% from ` 942.64 billion at March 31, 2010 to ` 1,095.54 billion at March 31, 2011
primarily due to an increase in call and term borrowings and an increase in capital-eligible borrowings in the nature of
sub-ordinated debt. The capital-eligible borrowings in the nature of sub-ordinated debt increased to ` 363.91 billion
at March 31, 2011 compared to ` 329.67 billion at March 31, 2010. RBI issued guidelines, effective April 1, 2010,
which require market repurchase transactions (previously accounted for as sale and repurchase) to be accounted
for as borrowing and lending. The transactions with RBI under LAF which are accounted for as sale and purchase
transactions.
Equity share capital and reserves
Equity share capital and reserves increased from ` 516.18 billion at March 31, 2010 to ` 550.91 billion at March 31,
2011 (including statutory reserve of ` 2.00 billion taken over from Bank of Rajasthan at August 12, 2010) primarily
due to allotment of shares to the shareholders of Bank of Rajasthan and annual accretion to reserves out of profit.
Excess of paid-up value of equity shares issued over the fair value of the net assets acquired in the amalgamation
and amalgamation expenses, amounting to ` 2.10 billion have been adjusted against the securities premium account.
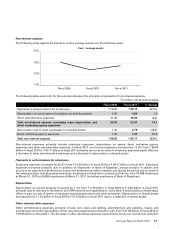
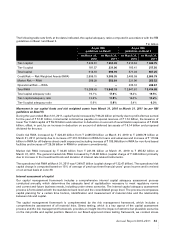
Off balance sheet items, commitments and contingencies
The following table sets forth, for the periods indicated, the principal components of contingent liabilities.
` in billion
March 31, 2010 March 31, 2011
Claims against the Bank, not acknowledged as debts ` 33.57 ` 17.02
Liability for partly paid investments 0.13 0.13
Notional principal amount of outstanding forward exchange contracts 1,660.69 2,468.62
Guarantees given on behalf of constituents 618.36 826.27
Acceptances, endorsements and other obligations 321.22 393.34
Notional principal amount of currency swaps 524.79 561.28
Notional principal amount of Interest rate swaps and currency options 4,012.14 4,903.90
Other items for which the Bank is contingently liable 99.94 60.66
Total ` 7,270.84 ` 9,231.22
We enter into foreign exchange forwards, options, swaps and other derivative products to enable customers to
transfer, modify or reduce their foreign exchange and interest rate risk and to manage our own interest rate and foreign
exchange positions. We manage our foreign exchange and interest rate risk with reference to limits set by RBI as well
as those set internally. An interest rate swap does not entail exchange of notional principal and the cash flow arises
on account of the difference between interest rate pay and receive legs of the swaps which is generally much smaller
than the notional principal of the swap. With respect to the transactions entered into with customers, we generally
enter into off-setting transactions in the inter-bank market. This results in generation of a higher number of outstanding
transactions and hence a large value of gross notional principal of the portfolio, while the net market risk is low. For
example, if a transaction entered into with a customer is covered by an exactly opposite transaction entered into with
counter-party, the net market risk of the two transactions will be zero whereas the notional principal which is reflected
as an off-balance sheet item will be the sum of both the transactions.
Annual Report 2010-2011 61