ICICI Bank 2011 Annual Report Download - page 59
Download and view the complete annual report
Please find page 59 of the 2011 ICICI Bank annual report below. You can navigate through the pages in the report by either clicking on the pages listed below, or by using the keyword search tool below to find specific information within the annual report.-
 1
1 -
2
-
3
-
4
-
5
-
6
-
7
-
8
-
9
-
10
-
11
-
12
-
13
-
14
-
15
-
16
-
17
-
18
-
19
-
20
-
21
-
22
-
23
-
24
-
25
-
26
-
27
-
28
-
29
-
30
-
31
-
32
-
33
-
34
-
35
-
36
-
37
-
38
-
39
-
40
-
41
-
42
-
43
-
44
-
45
-
46
-
47
-
48
-
 49
49 -
 50
50 -
 51
51 -
 52
52 -
 53
53 -
 54
54 -
 55
55 -
 56
56 -
 57
57 -
 58
58 -
 59
59 -
 60
60 -
 61
61 -
 62
62 -
 63
63 -
 64
64 -
 65
65 -
 66
66 -
 67
67 -
 68
68 -
 69
69 -
70
-
71
-
72
-
73
-
74
-
75
-
76
-
77
-
78
-
79
-
80
-
81
-
82
-
83
-
84
-
85
-
86
-
87
-
88
-
89
-
90
-
91
-
92
-
93
-
94
-
95
-
96
-
97
-
98
-
99
-
100
-
101
-
102
-
103
-
104
-
105
-
106
-
107
-
108
-
109
-
110
-
111
-
112
-
113
-
114
-
115
-
116
-
117
-
118
-
119
-
120
-
121
-
122
-
123
-
124
-
125
-
126
-
127
-
128
-
129
-
130
-
131
-
132
-
133
-
134
-
135
-
136
-
137
-
138
-
139
-
140
-
141
-
142
-
143
-
144
-
145
-
146
-
147
-
148
-
149
-
150
-
151
-
152
-
153
-
154
-
155
-
156
-
157
-
158
-
159
-
160
-
161
-
162
-
163
-
164
-
165
-
166
-
167
-
168
-
169
-
170
-
171
-
172
-
173
-
174
-
175
-
176
-
177
-
178
-
179
-
180
-
181
-
182
-
183
-
184
-
185
-
186
-
187
-
188
-
189
-
190
-
191
-
192
-
193
-
194
-
195
-
196
-
197
-
198
-
199
-
200
-
201
-
202
-
203
-
204
 |
 |

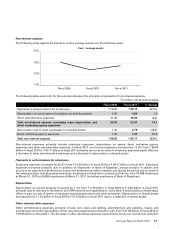
Non-interest expense
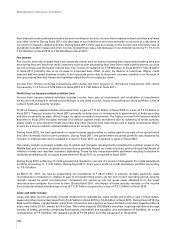
The following chart depicts the trends in cost to average assets over the last three years.
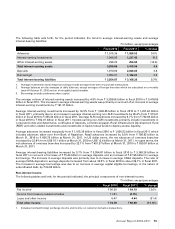
The following table sets forth, for the periods indicated, the principal components of non-interest expense.
` in billion, except percentages
Fiscal 2010 Fiscal 2011 % change
Payments to and provisions for employees ` 19.26 ` 28.17 46.3%
Depreciation on own property (including non banking assets) 4.78 4.84 1.3
Other administrative expenses 31.89 30.80 (3.4)
Total non-interest expense (excluding lease depreciation and
direct marketing agency expenses)
55.93 63.81 14.1
Depreciation (net of lease equalisation) on leased assets 1.42 0.79 (44.4)
Direct marketing agency expenses 1.25 1.57 25.6
Total non-interest expense ` 58.60 ` 66.17 12.9%
Non-interest expenses primarily include employee expenses, depreciation on assets, direct marketing agency
expenses and other administrative expenses. In fiscal 2011, non-interest expenses increased by 12.9% from ` 58.60
billion in fiscal 2010 to ` 66.17 billion in fiscal 2011 primarily due to an increase in employee expenses partly offset by
a decrease in other administrative expenses and a decrease in depreciation on leased assets.
Payments to and provisions for employees
Employee expenses increased by 46.3% from ` 19.26 billion in fiscal 2010 to ` 28.17 billion in fiscal 2011. Employee
expenses increased primarily due to addition of employees of Bank of Rajasthan, annual increase in salaries and
provision for payment of performance bonus and performance-linked retention pay during the period and increase in
the employee base, including sales executives, employees on fixed term contracts and interns, from 41,068 employees
at March 31, 2010 to 56,969 employees at March 31, 2011 (including employees of Bank of Rajasthan).
Depreciation
Depreciation on owned property increased by 1.3% from ` 4.78 billion in fiscal 2010 to ` 4.84 billion in fiscal 2011
primarily due to increase in the branch and ATM network and capitalisation of the Bank’s new building in Hyderabad,
offset, in part, by sale of assets of merchant acquiring operations and other properties. Depreciation on leased assets
decreased from ` 1.42 billion in fiscal 2010 to ` 0.79 billion in fiscal 2011 due to a reduction in leased assets.
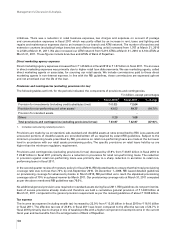
Other administrative expenses
Other administrative expenses primarily include rent, taxes and lighting, advertisement and publicity, repairs and
maintenance and other expenditure. Other operating expenses decreased by 3.4% from ` 31.89 billion in fiscal 2010 to
` 30.80 billion in fiscal 2011. The decrease in other operating expenses was primarily due to our overall cost reduction
Fiscal 2009 Fiscal 2010 Fiscal 2011
Cost / average assets
2.0%
1.8%
1.5%
1.3%
Annual Report 2010-2011 57