ICICI Bank 2011 Annual Report Download - page 110
Download and view the complete annual report
Please find page 110 of the 2011 ICICI Bank annual report below. You can navigate through the pages in the report by either clicking on the pages listed below, or by using the keyword search tool below to find specific information within the annual report.-
 1
1 -
2
-
3
-
4
-
5
-
6
-
7
-
8
-
9
-
10
-
11
-
12
-
13
-
14
-
15
-
16
-
17
-
18
-
19
-
20
-
21
-
22
-
23
-
24
-
25
-
26
-
27
-
28
-
29
-
30
-
31
-
32
-
33
-
34
-
35
-
36
-
37
-
38
-
39
-
40
-
41
-
42
-
43
-
44
-
45
-
46
-
47
-
48
-
49
-
50
-
51
-
52
-
53
-
54
-
55
-
56
-
57
-
58
-
59
-
60
-
61
-
62
-
63
-
64
-
65
-
66
-
67
-
68
-
69
-
70
-
71
-
72
-
73
-
74
-
75
-
76
-
77
-
78
-
79
-
80
-
81
-
82
-
83
-
84
-
85
-
86
-
87
-
88
-
89
-
90
-
91
-
92
-
93
-
94
-
95
-
96
-
97
-
98
-
99
-
 100
100 -
 101
101 -
 102
102 -
 103
103 -
 104
104 -
 105
105 -
 106
106 -
 107
107 -
 108
108 -
 109
109 -
 110
110 -
 111
111 -
 112
112 -
 113
113 -
 114
114 -
 115
115 -
 116
116 -
 117
117 -
 118
118 -
 119
119 -
 120
120 -
121
-
122
-
123
-
124
-
125
-
126
-
127
-
128
-
129
-
130
-
131
-
132
-
133
-
134
-
135
-
136
-
137
-
138
-
139
-
140
-
141
-
142
-
143
-
144
-
145
-
146
-
147
-
148
-
149
-
150
-
151
-
152
-
153
-
154
-
155
-
156
-
157
-
158
-
159
-
160
-
161
-
162
-
163
-
164
-
165
-
166
-
167
-
168
-
169
-
170
-
171
-
172
-
173
-
174
-
175
-
176
-
177
-
178
-
179
-
180
-
181
-
182
-
183
-
184
-
185
-
186
-
187
-
188
-
189
-
190
-
191
-
192
-
193
-
194
-
195
-
196
-
197
-
198
-
199
-
200
-
201
-
202
-
203
-
204
 |
 |

F32
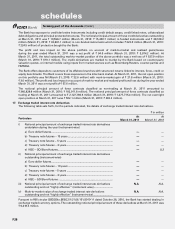
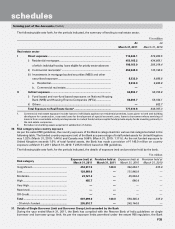
26. Details of non-performing assets purchased/sold, excluding those sold to SC/RC
The Bank has not purchased any non-performing assets in terms of the guidelines issued by the RBI circular no.
DBOD.No.BP.BC.16/21.04.048/2005-06 dated July 13, 2005. The Bank has sold certain non-performing assets in terms of
these RBI guidelines.
The following table sets forth, for the periods indicated, details of non-performing assets sold, excluding those sold to SC/RC.
` in million, except no. of accounts
Particulars Year ended
March 31, 2011
Year ended
March 31, 2010
No. of accounts1 ........................................................................................................... —7,428
Aggregate value (net of provisions) of accounts sold,
excluding those sold to SC/RC .................................................................................... —479.0
Aggregate consideration ............................................................................................. —463.6
Aggregate gain/(loss) over net book value ................................................................ —(15.4)
1. Excludes accounts previously written-off.
27. Floating provision
The Bank holds floating provision of ` 1.9 million at March 31, 2011 which was taken over from erstwhile Bank of
Rajasthan on amalgamation.
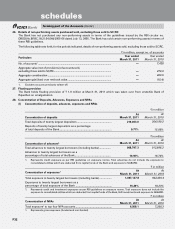
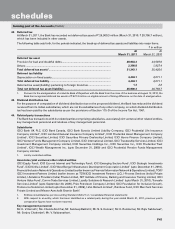
28. Concentration of Deposits, Advances, Exposures and NPAs
(I) Concentration of deposits, advances, exposures and NPAs
` in million
Concentration of deposits
At
March 31, 2011
At
March 31, 2010
Total deposits of twenty largest depositors ............................................... 219,063.0 304,189.2
Deposits of twenty largest depositors as a percentage
of total deposits of the Bank ....................................................................... 9.71% 15.06%
` in million
Concentration of advances1
At
March 31, 2011
At
March 31, 2010
Total advances to twenty largest borrowers (including banks) ................ 968,797.3 912,696.2
Advances to twenty largest borrowers as a
percentage of total advances of the Bank ................................................. 16.93% 18.74%
1. Represents credit exposure as per RBI guidelines on exposure norms. Total advances do not include the exposure to
consolidated entities which are deducted from capital funds of the Bank and exposure to NABARD.
` in million
Concentration of exposures1At
March 31, 2011
At
March 31, 2010
Total exposure to twenty largest borrowers (including banks) ................. 1,007,127.8 942,409.4
Exposures to twenty largest borrowers as a
percentage of total exposure of the Bank ................................................. 16.29% 18.23%
1. Represents credit and investment exposures as per RBI guidelines on exposure norms. Total exposure does not include the
exposure to consolidated entities which are deducted from capital funds of the Bank, SLR investments and exposure to NABARD.
` in million
Concentration of NPAs At
March 31, 2011
At
March 31, 2010
Total exposure1 to top four NPA accounts ................................................. 6,508.1 7,200.3
1. Represents gross exposure (funded and non-funded)
forming part of the Accounts (Contd.)
schedules