ICICI Bank 2011 Annual Report Download - page 114
Download and view the complete annual report
Please find page 114 of the 2011 ICICI Bank annual report below. You can navigate through the pages in the report by either clicking on the pages listed below, or by using the keyword search tool below to find specific information within the annual report.-
 1
1 -
2
-
3
-
4
-
5
-
6
-
7
-
8
-
9
-
10
-
11
-
12
-
13
-
14
-
15
-
16
-
17
-
18
-
19
-
20
-
21
-
22
-
23
-
24
-
25
-
26
-
27
-
28
-
29
-
30
-
31
-
32
-
33
-
34
-
35
-
36
-
37
-
38
-
39
-
40
-
41
-
42
-
43
-
44
-
45
-
46
-
47
-
48
-
49
-
50
-
51
-
52
-
53
-
54
-
55
-
56
-
57
-
58
-
59
-
60
-
61
-
62
-
63
-
64
-
65
-
66
-
67
-
68
-
69
-
70
-
71
-
72
-
73
-
74
-
75
-
76
-
77
-
78
-
79
-
80
-
81
-
82
-
83
-
84
-
85
-
86
-
87
-
88
-
89
-
90
-
91
-
92
-
93
-
94
-
95
-
96
-
97
-
98
-
99
-
100
-
101
-
102
-
103
-
 104
104 -
 105
105 -
 106
106 -
 107
107 -
 108
108 -
 109
109 -
 110
110 -
 111
111 -
 112
112 -
 113
113 -
 114
114 -
 115
115 -
 116
116 -
 117
117 -
 118
118 -
 119
119 -
 120
120 -
 121
121 -
 122
122 -
 123
123 -
 124
124 -
125
-
126
-
127
-
128
-
129
-
130
-
131
-
132
-
133
-
134
-
135
-
136
-
137
-
138
-
139
-
140
-
141
-
142
-
143
-
144
-
145
-
146
-
147
-
148
-
149
-
150
-
151
-
152
-
153
-
154
-
155
-
156
-
157
-
158
-
159
-
160
-
161
-
162
-
163
-
164
-
165
-
166
-
167
-
168
-
169
-
170
-
171
-
172
-
173
-
174
-
175
-
176
-
177
-
178
-
179
-
180
-
181
-
182
-
183
-
184
-
185
-
186
-
187
-
188
-
189
-
190
-
191
-
192
-
193
-
194
-
195
-
196
-
197
-
198
-
199
-
200
-
201
-
202
-
203
-
204
 |
 |

F36
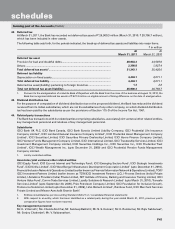
with the approval of the Board of Directors can enhance exposure to a single borrower or borrower group by a further
5 percent of capital funds. During the year ended March 31, 2011, with the prior approval of the Board of Directors, the
Bank exceeded the single borrower limit of 15% of capital funds to Reliance Industries Limited. At March 31, 2011, the
exposure to Reliance Industries Limited as a percentage of capital funds was 12.4%.
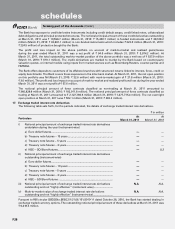
32. Unsecured advances against intangible assets
The Bank has made advances against intangible collaterals of the borrowers which are classified as ‘unsecured’ in its
financial statements. At March 31, 2011, the amount of such advances was Nil (March 31, 2010: Nil) and the estimated
value of the intangible collaterals was Nil (March 31, 2010: Nil).
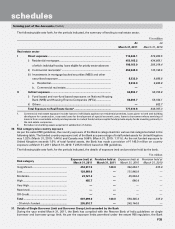
33. Fixed Assets
The following table sets forth, for the periods indicated, the movement in software acquired by the Bank, as included in fixed assets.
` in million
Particulars At
March 31, 2011
At
March 31, 2010
At cost at March 31st of preceding year .............................................................. 5,852.6 5,267.4
Additions during the year1 .................................................................................... 737.6 824.9
Deductions during the year .................................................................................. (0.6) (239.7)
Depreciation to date .............................................................................................. (4,830.8) (4,043.3)
Net block ................................................................................................................ 1,758.8 1,809.3
1. Includes impact of acquisition of erstwhile Bank of Rajasthan.
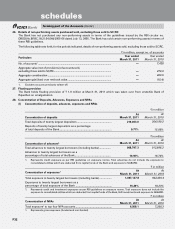
34. Assets given on lease
Assets under finance lease
The following table sets forth, for the periods indicated, the details of finance leases.
` in million
Particulars At
March 31, 2011
At
March 31, 2010
Future minimum lease receipts
Present value of lease receipts ............................................................................. 6.8 17.4
Unmatured finance charges .................................................................................. 0.6 0.2
Total ....................................................................................................................... 7.4 17.6
Maturity profile of future minimum lease receipts
- Not later than one year ....................................................................................... 2.7 17.6
- Later than one year and not later than five years .............................................. 4.7 —
- Later than five years ............................................................................................ ——
Total ....................................................................................................................... 7.4 17.6
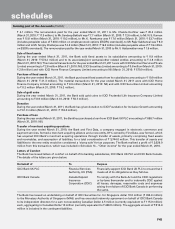
Maturity profile of present value of lease rentals
The following table sets forth, for the periods indicated, the details of maturity profile of present value of finance lease
receipts.
` in million
Particulars At
March 31, 2011
At
March 31, 2010
Not later than one year ........................................................................................ 2.4 17.4
Later than one year and not later than five years ............................................... 4.4 —
Later than five years ............................................................................................. ——
Total ...................................................................................................................... 6.8 17.4
forming part of the Accounts (Contd.)
schedules