ICICI Bank 2011 Annual Report Download - page 28
Download and view the complete annual report
Please find page 28 of the 2011 ICICI Bank annual report below. You can navigate through the pages in the report by either clicking on the pages listed below, or by using the keyword search tool below to find specific information within the annual report.-
 1
1 -
2
-
3
-
4
-
5
-
6
-
7
-
8
-
9
-
10
-
11
-
12
-
13
-
14
-
15
-
16
-
17
-
 18
18 -
 19
19 -
 20
20 -
 21
21 -
 22
22 -
 23
23 -
 24
24 -
 25
25 -
 26
26 -
 27
27 -
 28
28 -
 29
29 -
 30
30 -
 31
31 -
 32
32 -
 33
33 -
 34
34 -
 35
35 -
 36
36 -
 37
37 -
 38
38 -
39
-
40
-
41
-
42
-
43
-
44
-
45
-
46
-
47
-
48
-
49
-
50
-
51
-
52
-
53
-
54
-
55
-
56
-
57
-
58
-
59
-
60
-
61
-
62
-
63
-
64
-
65
-
66
-
67
-
68
-
69
-
70
-
71
-
72
-
73
-
74
-
75
-
76
-
77
-
78
-
79
-
80
-
81
-
82
-
83
-
84
-
85
-
86
-
87
-
88
-
89
-
90
-
91
-
92
-
93
-
94
-
95
-
96
-
97
-
98
-
99
-
100
-
101
-
102
-
103
-
104
-
105
-
106
-
107
-
108
-
109
-
110
-
111
-
112
-
113
-
114
-
115
-
116
-
117
-
118
-
119
-
120
-
121
-
122
-
123
-
124
-
125
-
126
-
127
-
128
-
129
-
130
-
131
-
132
-
133
-
134
-
135
-
136
-
137
-
138
-
139
-
140
-
141
-
142
-
143
-
144
-
145
-
146
-
147
-
148
-
149
-
150
-
151
-
152
-
153
-
154
-
155
-
156
-
157
-
158
-
159
-
160
-
161
-
162
-
163
-
164
-
165
-
166
-
167
-
168
-
169
-
170
-
171
-
172
-
173
-
174
-
175
-
176
-
177
-
178
-
179
-
180
-
181
-
182
-
183
-
184
-
185
-
186
-
187
-
188
-
189
-
190
-
191
-
192
-
193
-
194
-
195
-
196
-
197
-
198
-
199
-
200
-
201
-
202
-
203
-
204
 |
 |

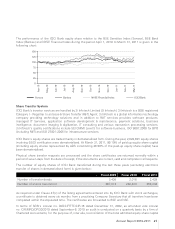
Market Price Information
The reported high and low closing prices and volume of equity shares of ICICI Bank traded during fiscal 2011
on BSE and NSE are set out in the following table:
Month
BSE NSE Total Volume
on BSE and
NSE
High `Low `Volume High `Low `Volume
April 2010 997.95 918.10 12,535,994 997.80 918.00 84,117,665 96,653,659
May 2010 937.90 809.40 15,992,523 936.90 809.35 94,701,942 110,694,465
June 2010 902.00 816.90 14,254,026 900.40 817.50 84,532,263 98,786,289
July 2010 926.50 840.10 9,682,699 928.70 840.05 63,169,412 72,852,111
August 2010 1,012.55 939.75 12,027,278 1,013.00 939.55 88,641,472 100,668,750
September 2010 1,128.40 994.60 10,715,288 1,127.75 995.00 73,668,966 84,384,254
October 2010 1,161.65 1,090.30 9,763,021 1,163.00 1,089.05 75,532,788 85,295,809
November 2010 1,269.70 1,117.25 9,667,547 1,273.35 1,116.25 90,120,342 99,787,889
December 2010 1,190.15 1,057.20 9,879,510 1,191.15 1,058.30 81,019,901 90,899,411
January 2011 1,143.60 1,000.70 15,682,632 1,144.85 1,001.15 99,452,527 115,135,159
February 2011 1,057.95 951.10 11,038,536 1,057.00 951.35 86,603,211 97,641,747
March 2011 1,112.75 996.45 10,776,829 1,116.20 996.60 82,174,857 92,951,686
Fiscal 2011 1,269.70 809.40 142,015,883 1,273.35 809.35 1,003,735,346 1,145,751,229
The reported high and low closing prices and volume of ADSs of ICICI Bank traded during fiscal 2011 on the
NYSE are given below:
Month High (US$) Low (US$) Number of ADS traded
April 2010 45.79 40.81 49,881,511
May 2010 42.43 34.85 57,646,086
June 2010 38.97 34.96 47,010,422
July 2010 39.36 35.77 36,067,211
August 2010 42.68 40.73 44,429,157
September 2010 49.85 42.98 39,079,340
October 2010 52.58 49.45 44,074,372
November 2010 57.57 50.04 42,044,662
December 2010 53.31 46.46 34,502,499
January 2011 51.10 43.32 63,181,108
February 2011 46.24 42.31 44,328,567
March 2011 50.08 44.20 48,336,203
Fiscal 2011 57.57 34.85 550,581,138
Source: Google Finance
Directors’ Report
26