ICICI Bank 2011 Annual Report Download - page 57
Download and view the complete annual report
Please find page 57 of the 2011 ICICI Bank annual report below. You can navigate through the pages in the report by either clicking on the pages listed below, or by using the keyword search tool below to find specific information within the annual report.-
 1
1 -
2
-
3
-
4
-
5
-
6
-
7
-
8
-
9
-
10
-
11
-
12
-
13
-
14
-
15
-
16
-
17
-
18
-
19
-
20
-
21
-
22
-
23
-
24
-
25
-
26
-
27
-
28
-
29
-
30
-
31
-
32
-
33
-
34
-
35
-
36
-
37
-
38
-
39
-
40
-
41
-
42
-
43
-
44
-
45
-
46
-
 47
47 -
 48
48 -
 49
49 -
 50
50 -
 51
51 -
 52
52 -
 53
53 -
 54
54 -
 55
55 -
 56
56 -
 57
57 -
 58
58 -
 59
59 -
 60
60 -
 61
61 -
 62
62 -
 63
63 -
 64
64 -
 65
65 -
 66
66 -
 67
67 -
68
-
69
-
70
-
71
-
72
-
73
-
74
-
75
-
76
-
77
-
78
-
79
-
80
-
81
-
82
-
83
-
84
-
85
-
86
-
87
-
88
-
89
-
90
-
91
-
92
-
93
-
94
-
95
-
96
-
97
-
98
-
99
-
100
-
101
-
102
-
103
-
104
-
105
-
106
-
107
-
108
-
109
-
110
-
111
-
112
-
113
-
114
-
115
-
116
-
117
-
118
-
119
-
120
-
121
-
122
-
123
-
124
-
125
-
126
-
127
-
128
-
129
-
130
-
131
-
132
-
133
-
134
-
135
-
136
-
137
-
138
-
139
-
140
-
141
-
142
-
143
-
144
-
145
-
146
-
147
-
148
-
149
-
150
-
151
-
152
-
153
-
154
-
155
-
156
-
157
-
158
-
159
-
160
-
161
-
162
-
163
-
164
-
165
-
166
-
167
-
168
-
169
-
170
-
171
-
172
-
173
-
174
-
175
-
176
-
177
-
178
-
179
-
180
-
181
-
182
-
183
-
184
-
185
-
186
-
187
-
188
-
189
-
190
-
191
-
192
-
193
-
194
-
195
-
196
-
197
-
198
-
199
-
200
-
201
-
202
-
203
-
204
 |
 |

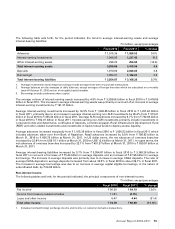
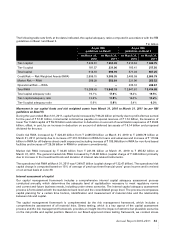
The following table sets forth, for the period indicated, the trend in average interest-earning assets and average
interest-bearing liabilities:
` in billion, except percentages
Fiscal 2010 Fiscal 2011 % change
Advances ` 1,915.39 ` 1,926.52 0.6%
Interest-earning investments 1,046.05 1,237.42 18.3
Other interest-earning assets 298.22 254.65 (14.6)
Total interest-earning assets 3,259.66 3,418.59 4.9
Deposits 1,970.60 2,046.04 3.8
Borrowings31,084.27 1,122.23 3.5
Total interest-bearing liabilities ` 3,054.87 ` 3,168.26 3.7%
1. Average investments and average borrowings include average short-term re-purchase transactions.
2. Average balances are the averages of daily balances, except averages of foreign branches which are calculated on a monthly
basis till October 31, 2010 and on a fortnightly basis thereafter.
3. Borrowings exclude preference share capital.
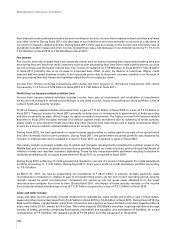
The average volume of interest-earning assets increased by 4.9% from ` 3,259.66 billion in fiscal 2010 to ` 3,418.59
billion in fiscal 2011. The increase in average interest-earning assets was primarily on account of an increase in average
interest-earning investments by ` 191.37 billion.
Average interest-earning investments increased by 18.3% from ` 1,046.05 billion in fiscal 2010 to ` 1,237.42 billion
in fiscal 2011, primarily due to an increase in average interest-earning non-SLR investments by 45.4% from ` 313.21
billion in fiscal 2010 to ` 455.34 billion in fiscal 2011. Average SLR investments increased by 6.7% from ` 732.84 billion
in fiscal 2010 to ` 782.07 billion in fiscal 2011. Interest-earning non-SLR investments primarily include investments in
corporate bonds and debentures, certificates of deposits, commercial paper, Rural Infrastructure Development Fund
(RIDF) and other related investments and investments in liquid mutual funds to deploy excess liquidity.
Average advances increased marginally from ` 1,915.39 billion in fiscal 2010 to ` 1,926.52 billion in fiscal 2011 which
includes advances taken over from Bank of Rajasthan. Retail advances increased by 5.8% from ` 790.62 billion at
March 31, 2010 to ` 836.75 billion at March 31, 2011. In US dollar terms, the net advances of overseas branches
increased by 22.8% from US$ 10.1 billion at March 31, 2010 to US$ 12.4 billion at March 31, 2011. In rupee terms, the
net advances of overseas branches increased by 22.1% from ` 451.37 billion at March 31, 2010 to ` 550.97 billion at
March 31, 2011.
Average interest-bearing liabilities increased by 3.7% from ` 3,054.87 billion in fiscal 2010 to ` 3,168.26 billion in
fiscal 2011 on account of increase of ` 75.44 billion in average deposits and an increase of ` 37.96 billion in average
borrowings. The increase in average deposits was primarily due to increase in average CASA deposits. The ratio of
average CASA deposits to average deposits increased from about 32.5% in fiscal 2010 to about 39.1% in fiscal 2011.
The increase in average borrowings was due to an increase in average capital eligible borrowings, in the nature of
subordinated debt, by ` 64.66 billion.
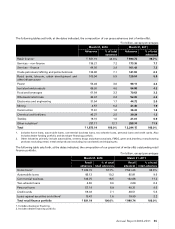
Non-interest income
The following tables set forth, for the periods indicated, the principal components of non-interest income.
` in billion, except percentages
Fiscal 2010 Fiscal 2011 % change
Fee income1` 56.50 ` 64.19 13.6%
Income from treasury-related activities 11.81 (2.15) -
Lease and other income 6.47 4.44 (31.4)
Total other income ` 74.78 ` 66.48 (11.1)%
1. Includes merchant foreign exchange income and income on customer derivative transactions.
Annual Report 2010-2011 55