ICICI Bank 2011 Annual Report Download - page 65
Download and view the complete annual report
Please find page 65 of the 2011 ICICI Bank annual report below. You can navigate through the pages in the report by either clicking on the pages listed below, or by using the keyword search tool below to find specific information within the annual report.-
 1
1 -
2
-
3
-
4
-
5
-
6
-
7
-
8
-
9
-
10
-
11
-
12
-
13
-
14
-
15
-
16
-
17
-
18
-
19
-
20
-
21
-
22
-
23
-
24
-
25
-
26
-
27
-
28
-
29
-
30
-
31
-
32
-
33
-
34
-
35
-
36
-
37
-
38
-
39
-
40
-
41
-
42
-
43
-
44
-
45
-
46
-
47
-
48
-
49
-
50
-
51
-
52
-
53
-
54
-
 55
55 -
 56
56 -
 57
57 -
 58
58 -
 59
59 -
 60
60 -
 61
61 -
 62
62 -
 63
63 -
 64
64 -
 65
65 -
 66
66 -
 67
67 -
 68
68 -
 69
69 -
 70
70 -
 71
71 -
 72
72 -
 73
73 -
 74
74 -
 75
75 -
76
-
77
-
78
-
79
-
80
-
81
-
82
-
83
-
84
-
85
-
86
-
87
-
88
-
89
-
90
-
91
-
92
-
93
-
94
-
95
-
96
-
97
-
98
-
99
-
100
-
101
-
102
-
103
-
104
-
105
-
106
-
107
-
108
-
109
-
110
-
111
-
112
-
113
-
114
-
115
-
116
-
117
-
118
-
119
-
120
-
121
-
122
-
123
-
124
-
125
-
126
-
127
-
128
-
129
-
130
-
131
-
132
-
133
-
134
-
135
-
136
-
137
-
138
-
139
-
140
-
141
-
142
-
143
-
144
-
145
-
146
-
147
-
148
-
149
-
150
-
151
-
152
-
153
-
154
-
155
-
156
-
157
-
158
-
159
-
160
-
161
-
162
-
163
-
164
-
165
-
166
-
167
-
168
-
169
-
170
-
171
-
172
-
173
-
174
-
175
-
176
-
177
-
178
-
179
-
180
-
181
-
182
-
183
-
184
-
185
-
186
-
187
-
188
-
189
-
190
-
191
-
192
-
193
-
194
-
195
-
196
-
197
-
198
-
199
-
200
-
201
-
202
-
203
-
204
 |
 |

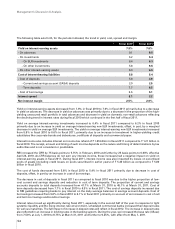
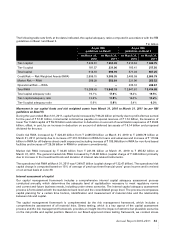
The following table sets forth, at the dates indicated, the capital adequacy ratios computed in accordance with the RBI
guidelines on Basel I and Basel II.
` in billion
As per RBI
guidelines on Basel I
As per RBI
guidelines on Basel II
At March 31,
2010
At March 31,
2011
At March 31,
2010
At March 31,
2011
Tier-I capital ` 432.61 ` 463.99 ` 410.62 ` 449.75
Tier-II capital 181.57 231.00 160.41 217.50
Total capital 614.18 694.99 571.03 667.25
Credit Risk — Risk Weighted Assets (RWA) 2,899.15 3,389.35 2,485.59 2,909.79
Market Risk — RWA 309.28 552.84 221.06 255.52
Operational Risk — RWA -- -- 235.16 249.67
Total RWA ` 3,208.43 ` 3,942.19 ` 2,941.81 ` 3,414.98
Total capital adequacy ratio 19.1% 17.6% 19.4% 19.5%
Tier-I capital adequacy ratio 13.5% 11.8% 14.0% 13.2%
Tier-II capital adequacy ratio 5.6% 5.8% 5.4% 6.3%
Movement in our capital funds and risk weighted assets from March 31, 2010 to March 31, 2011 (as per RBI
guidelines on Basel II)
During the year ended March 31, 2011, capital funds increased by ` 96.22 billion primarily due to profit after tax earned
for the year of ` 51.51 billion, incremental notional tax payable on special reserves of ` 1.74 billion, the issuance of
lower Tier II debt capital of ` 59.79 billion and reduction in deduction on account of securitization exposures of ` 25.06
billion, offset, in part, by an increase in deduction on account of deferred tax assets of ` 6.14 billion and proposed
dividend for the year.
Credit risk RWA increased by ` 424.20 billion from ` 2,485.59 billion at March 31, 2010 to ` 2,909.79 billion at
March 31, 2011 primarily due to increase of ` 310.19 billion in RWA for loans and advances and increase of ` 115.99
billion in RWA for off-balance sheet credit exposures (including increase of ` 105.99 billion in RWA for non-fund based
facilities and increase of ` 29.39 billion in RWA for undrawn commitments).
Market risk RWA increased by ` 34.46 billion from ` 221.06 billion at March 31, 2010 to ` 255.52 billion at
March 31, 2011. The general market risk RWA increased by ` 42.86 billion (capital charge of ` 3.86 billion) primarily
due to increase in the investment book and duration of interest rate related instruments.
The operational risk RWA at March 31, 2011 was ` 249.67 billion (capital charge of ` 22.47 billion). The operational risk
capital charge is computed based on 15% of average of previous three financial years’ gross income and is revised
on an annual basis at June 30.
Internal assessment of capital
Our capital management framework includes a comprehensive internal capital adequacy assessment process
conducted annually, which determines the adequate level of capitalisation necessary to meet regulatory norms
and current and future business needs, including under stress scenarios. The internal capital adequacy assessment
process is formulated at both the standalone bank level and the consolidated group level. The process encompasses
capital planning for a certain time horizon, identification and measurement of material risks and the relationship
between risk and capital.
The capital management framework is complemented by the risk management framework, which includes a
comprehensive assessment of all material risks. Stress testing, which is a key aspect of the capital assessment
process and the risk management framework, provides an insight into the impact of extreme but plausible scenarios
on the risk profile and capital position. Based on our Board-approved stress testing framework, we conduct stress
Annual Report 2010-2011 63