ICICI Bank 2011 Annual Report Download - page 107
Download and view the complete annual report
Please find page 107 of the 2011 ICICI Bank annual report below. You can navigate through the pages in the report by either clicking on the pages listed below, or by using the keyword search tool below to find specific information within the annual report.-
 1
1 -
2
-
3
-
4
-
5
-
6
-
7
-
8
-
9
-
10
-
11
-
12
-
13
-
14
-
15
-
16
-
17
-
18
-
19
-
20
-
21
-
22
-
23
-
24
-
25
-
26
-
27
-
28
-
29
-
30
-
31
-
32
-
33
-
34
-
35
-
36
-
37
-
38
-
39
-
40
-
41
-
42
-
43
-
44
-
45
-
46
-
47
-
48
-
49
-
50
-
51
-
52
-
53
-
54
-
55
-
56
-
57
-
58
-
59
-
60
-
61
-
62
-
63
-
64
-
65
-
66
-
67
-
68
-
69
-
70
-
71
-
72
-
73
-
74
-
75
-
76
-
77
-
78
-
79
-
80
-
81
-
82
-
83
-
84
-
85
-
86
-
87
-
88
-
89
-
90
-
91
-
92
-
93
-
94
-
95
-
96
-
 97
97 -
 98
98 -
 99
99 -
 100
100 -
 101
101 -
 102
102 -
 103
103 -
 104
104 -
 105
105 -
 106
106 -
 107
107 -
 108
108 -
 109
109 -
 110
110 -
 111
111 -
 112
112 -
 113
113 -
 114
114 -
 115
115 -
 116
116 -
 117
117 -
118
-
119
-
120
-
121
-
122
-
123
-
124
-
125
-
126
-
127
-
128
-
129
-
130
-
131
-
132
-
133
-
134
-
135
-
136
-
137
-
138
-
139
-
140
-
141
-
142
-
143
-
144
-
145
-
146
-
147
-
148
-
149
-
150
-
151
-
152
-
153
-
154
-
155
-
156
-
157
-
158
-
159
-
160
-
161
-
162
-
163
-
164
-
165
-
166
-
167
-
168
-
169
-
170
-
171
-
172
-
173
-
174
-
175
-
176
-
177
-
178
-
179
-
180
-
181
-
182
-
183
-
184
-
185
-
186
-
187
-
188
-
189
-
190
-
191
-
192
-
193
-
194
-
195
-
196
-
197
-
198
-
199
-
200
-
201
-
202
-
203
-
204
 |
 |

F29
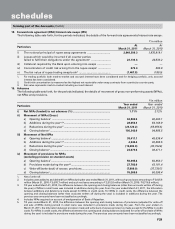
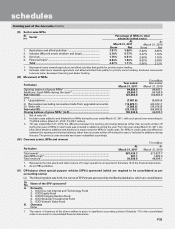
18. Forward rate agreement (FRA)/Interest rate swaps (IRS)
The following table sets forth, for the periods indicated, the details of the forward rate agreements/interest rate swaps.
` in million
Particulars At
March 31, 2011
At
March 31, 2010
i) The notional principal of rupee swap agreements ............................. 2,649,306.3 1,870,819.1
ii) Losses which would be incurred if all counter parties
failed to fulfil their obligations under the agreement1 ........................ 23,133.4 20,533.2
iii) Collateral required by the Bank upon entering into swaps ................. ——
iv) Concentration of credit risk arising from the rupee swaps2 ................ 673.4 500.0
v) The fair value of rupee trading swap book3 ........................................ (1,467.8) (180.5)
1. For trading portfolio both mark-to-market and accrued interest have been considered and for hedging portfolio, only accrued
interest has been considered.
2. Credit risk concentration is measured as the highest net receivable under swap contracts from a particular counter party.
3. Fair value represents mark-to-market including accrued interest.
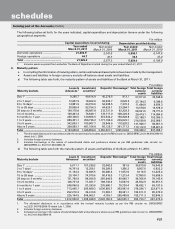
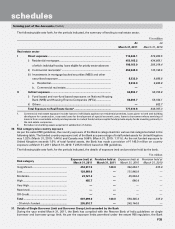
19. Advances
The following table sets forth, for the periods indicated, the details of movement of gross non-performing assets (NPAs),
net NPAs and provisions.
` in million
Particulars Year ended
March 31, 2011
Year ended
March 31, 2010
i) Net NPAs (funded) to net advances (%) ................................................... 1.11% 2.12%
ii) Movement of NPAs (Gross)
a) Opening balance1 ............................................................................... 94,806.5 96,493.1
b) Additions during the year2,3,4 ............................................................... 28,656.3 64,168.9
c) Reductions during the year2 ............................................................... (23,120.2) (65,855.5)
d) Closing balance1 .................................................................................. 100,342.6 94,806.5
iii) Movement of Net NPAs
a) Opening balance1 ................................................................................ 38,411.1 45,539.4
b) Additions during the year2,3,4 ............................................................... 4,946.4 36,666.5
c) Reductions during the year2 ............................................................... (19,283.9) (43,794.8)
d) Closing balance1 .................................................................................. 24,073.6 38,411.1
iv) Movement of provisions for NPAs
(excluding provision on standard assets)
a) Opening balance1 ................................................................................ 56,395.4 50,953.7
b) Provisions made during the year4,5 ..................................................... 27,782.6 43,181.4
c) Write-off/(write-back) of excess provisions ...................................... (7,909.0) (37,739.7)
d) Closing balance1 .................................................................................. 76,269.0 56,395.4
1. Net of write-off.
2. Includes cases added to and deleted from NPAs during the year ended March 31, 2011, with such gross loans amounting to ` 5,025.8
million (March 31, 2010: ` 9,970.7 million) and such net loans amounting to ` 3,512.0 million (March 31, 2010: ` 8,716.8 million).
3. Till year ended March 31, 2010, the difference between the opening and closing balances (other than accounts written off during
the year) of NPAs in retail loans was included in additions during the year. From the year ended March 31, 2011, the bifurcation
between additions and deletions is made except for NPAs in credit cards. For NPAs in credit cards, the difference between the
opening and closing balances (other than accounts written off during the year) is included in additions during the year. The
previous year amounts have been reclassified accordingly.
4. Includes NPAs acquired on account of amalgamation of Bank of Rajasthan.
5. Till year ended March 31, 2010, the difference between the opening and closing balances of provisions (adjusted for write-off
and sale of NPAs during period) in retail loans was included in provisions made during the year. From the year ended on
March 31, 2011, the bifurcation between provision made and write back of excess provision is made except for the NPAs in credit
cards. For NPAs in credit cards, the difference between the opening and closing balances (adjusted for write-off and sale of NPAs
during the year) is included in provisions made during the year. The previous year amounts have been reclassified accordingly.
forming part of the Accounts (Contd.)
schedules