Sallie Mae 2012 Annual Report Download - page 88
Download and view the complete annual report
Please find page 88 of the 2012 Sallie Mae annual report below. You can navigate through the pages in the report by either clicking on the pages listed below, or by using the keyword search tool below to find specific information within the annual report.-
 1
1 -
2
-
3
-
4
-
5
-
6
-
7
-
8
-
9
-
10
-
11
-
12
-
13
-
14
-
15
-
16
-
17
-
18
-
19
-
20
-
21
-
22
-
23
-
24
-
25
-
26
-
27
-
28
-
29
-
30
-
31
-
32
-
33
-
34
-
35
-
36
-
37
-
38
-
39
-
40
-
41
-
42
-
43
-
44
-
45
-
46
-
47
-
48
-
49
-
50
-
51
-
52
-
53
-
54
-
55
-
56
-
57
-
58
-
59
-
60
-
61
-
62
-
63
-
64
-
65
-
66
-
67
-
68
-
69
-
70
-
71
-
72
-
73
-
74
-
75
-
76
-
77
-
 78
78 -
 79
79 -
 80
80 -
 81
81 -
 82
82 -
 83
83 -
 84
84 -
 85
85 -
 86
86 -
 87
87 -
 88
88 -
 89
89 -
 90
90 -
 91
91 -
 92
92 -
 93
93 -
 94
94 -
 95
95 -
 96
96 -
 97
97 -
 98
98 -
99
-
100
-
101
-
102
-
103
-
104
-
105
-
106
-
107
-
108
-
109
-
110
-
111
-
112
-
113
-
114
-
115
-
116
-
117
-
118
-
119
-
120
-
121
-
122
-
123
-
124
-
125
-
126
-
127
-
128
-
129
-
130
-
131
-
132
-
133
-
134
-
135
-
136
-
137
-
138
-
139
-
140
-
141
-
142
-
143
-
144
-
145
-
146
-
147
-
148
-
149
-
150
-
151
-
152
-
153
-
154
-
155
-
156
-
157
-
158
-
159
-
160
-
161
-
162
-
163
-
164
-
165
-
166
-
167
-
168
-
169
-
170
-
171
-
172
-
173
-
174
-
175
-
176
-
177
-
178
-
179
-
180
-
181
-
182
-
183
-
184
-
185
-
186
-
187
-
188
-
189
-
190
-
191
-
192
-
193
-
194
-
195
-
196
-
197
-
198
-
199
-
200
-
201
-
202
-
203
-
204
-
205
-
206
-
207
 |
 |
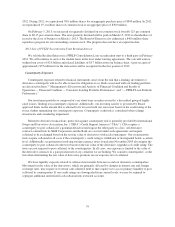
Fair Value Measurement
The most significant assumptions used in fair value measurements, including those related to credit and
liquidity risk, are as follows:
1. Investments — Our investments primarily consist of overnight/weekly maturity instruments with high
credit quality counterparties. However, we consider credit and liquidity risk involving specific
instruments in determining their fair value and, when appropriate, have adjusted the fair value of these
instruments for the effect of credit and liquidity risk. These assumptions have further been validated by
the successful maturity of these investments in the period immediately following the end of the
reporting period.
2. Derivatives — When determining the fair value of derivatives, we take into account counterparty
credit risk for positions where we are exposed to the counterparty on a net basis by assessing exposure
net of collateral held. The net exposure for each counterparty is adjusted based on market information
available for that specific counterparty, including spreads from credit default swaps. Additionally,
when the counterparty has exposure to us related to our derivatives, we fully collateralize the exposure,
minimizing the adjustment necessary to the derivative valuations for our own credit risk. Trusts that
contain derivatives are not required to post collateral to counterparties as the credit quality and
securitized nature of the trusts minimizes any adjustments for the counterparty’s exposure to the trusts.
Adjustments related to credit risk reduced the overall value of our derivatives by $111 million as of
December 31, 2012. We also take into account changes in liquidity when determining the fair value of
derivative positions. We adjusted the fair value of certain less liquid positions downward by
approximately $107 million to take into account a significant reduction in liquidity as of December 31,
2012, related primarily to basis swaps indexed to interest rate indices with inactive markets. A major
indicator of market inactivity is the widening of the bid/ask spread in these markets. In general, the
widening of counterparty credit spreads and reduced liquidity for derivative instruments as indicated by
wider bid/ask spreads will reduce the fair value of derivatives. In addition, certain cross-currency
interest rate swaps hedging foreign currency denominated reset rate and amortizing notes in our trusts
contain extension features that coincide with the remarketing dates of the notes. The valuation of the
extension feature requires significant judgment based on internally developed inputs.
3. Student Loans — Our FFELP Loans and Private Education Loans are accounted for at cost or at the
lower of cost or fair value if the loan is held-for-sale. The fair values of our student loans are disclosed
in “Note 13 — Fair Value Measurements.” For both FFELP Loans and Private Education Loans
accounted for at cost, fair value is determined by modeling loan level cash flows using stated terms of
the assets and internally-developed assumptions to determine aggregate portfolio yield, net present
value and average life. The significant assumptions used to project cash flows are prepayment speeds,
default rates, cost of funds, the amount funded by debt versus equity, and required return on equity. In
addition, the Floor Income component of our FFELP Loan portfolio is valued through discounted cash
flow and option models using both observable market inputs and internally developed inputs.
Significant inputs into the models are not generally market observable. They are either derived
internally through a combination of historical experience and management’s qualitative expectation of
future performance (in the case of prepayment speeds, default rates, and capital assumptions) or are
obtained through external broker quotes (as in the case of cost of funds). When possible, market
transactions are used to validate the model. In most cases, these are either infrequent or not observable.
For FFELP Loans classified as held-for-sale and accounted for at the lower of cost or market, the fair
value is based on the committed sales price of the various loan purchase programs established by ED.
For further information regarding the effect of our use of fair values on our results of operations, see
“Note 13 — Fair Value Measurements.”
86