Sallie Mae 2012 Annual Report Download - page 181
Download and view the complete annual report
Please find page 181 of the 2012 Sallie Mae annual report below. You can navigate through the pages in the report by either clicking on the pages listed below, or by using the keyword search tool below to find specific information within the annual report.
SLM CORPORATION
NOTES TO CONSOLIDATED FINANCIAL STATEMENTS (Continued)
13. Fair Value Measurements (Continued)
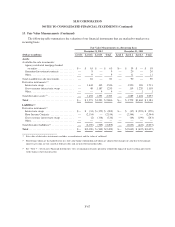
The following table summarizes the fair values of our financial assets and liabilities, including derivative
financial instruments.
December 31, 2012 December 31, 2011
(Dollars in millions)
Fair
Value
Carrying
Value Difference
Fair
Value
Carrying
Value Difference
Earning assets
FFELP Loans ....................... $125,042 $125,612 $ (570) $134,196 $138,130 $ (3,934)
Private Education Loans ............... 36,081 36,934 (853) 33,968 36,290 (2,322)
Cash and investments(1) ................ 9,994 9,994 — 9,789 9,789 —
Total earning assets ................... 171,117 172,540 (1,423) 177,953 184,209 (6,256)
Interest-bearing liabilities
Short-term borrowings ................ 19,861 19,856 (5) 29,547 29,573 26
Long-term borrowings ................ 146,210 152,401 6,191 141,605 154,393 12,788
Total interest-bearing liabilities ......... 166,071 172,257 6,186 171,152 183,966 12,814
Derivative financial instruments
Floor Income Contracts ............... (2,154) (2,154) — (2,544) (2,544) —
Interest rate swaps .................... 1,337 1,337 — 1,463 1,463 —
Cross currency interest rate swaps ....... 1,099 1,099 — 1,116 1,116 —
Other .............................. 4 4 — 1 1 —
Excess of net asset fair value over
carrying value .................... $4,763 $ 6,558
(1) “Cash and investments” includes available-for-sale investments that consist of investments that are primarily agency securities whose cost
basis is $78 million and $85 million at December 31, 2012 and 2011, respectively, versus a fair value of $81 million and $90 million at
December 31, 2012 and 2011, respectively.
The following includes a discussion of financial instruments whose fair value is included for disclosure
purposes only in the table above along with their level in the fair value hierarchy.
Student Loans
FFELP Loans
Fair values for FFELP Loans were determined by modeling loan cash flows using stated terms of the loans
and internally-developed assumptions. The significant assumptions used to determine fair value are prepayment
speeds, default rates, cost of funds, capital levels, and expected Repayment Borrower Benefits to be earned. In
addition, the Floor Income component of our FFELP Loan portfolio is valued with option models using both
observable market inputs and internally developed inputs. A number of significant inputs into the models are
internally derived and not observable to market participants. While the resulting fair value can be validated
against market transactions where we are a participant, these markets are not considered active. As such, these
are level 3 valuations.
Private Education Loans
Fair values for Private Education Loans were determined by modeling loan cash flows using stated terms of
the loans and internally-developed assumptions. The significant assumptions used to determine fair value are
F-71


