Sallie Mae 2012 Annual Report Download - page 174
Download and view the complete annual report
Please find page 174 of the 2012 Sallie Mae annual report below. You can navigate through the pages in the report by either clicking on the pages listed below, or by using the keyword search tool below to find specific information within the annual report.-
 1
1 -
2
-
3
-
4
-
5
-
6
-
7
-
8
-
9
-
10
-
11
-
12
-
13
-
14
-
15
-
16
-
17
-
18
-
19
-
20
-
21
-
22
-
23
-
24
-
25
-
26
-
27
-
28
-
29
-
30
-
31
-
32
-
33
-
34
-
35
-
36
-
37
-
38
-
39
-
40
-
41
-
42
-
43
-
44
-
45
-
46
-
47
-
48
-
49
-
50
-
51
-
52
-
53
-
54
-
55
-
56
-
57
-
58
-
59
-
60
-
61
-
62
-
63
-
64
-
65
-
66
-
67
-
68
-
69
-
70
-
71
-
72
-
73
-
74
-
75
-
76
-
77
-
78
-
79
-
80
-
81
-
82
-
83
-
84
-
85
-
86
-
87
-
88
-
89
-
90
-
91
-
92
-
93
-
94
-
95
-
96
-
97
-
98
-
99
-
100
-
101
-
102
-
103
-
104
-
105
-
106
-
107
-
108
-
109
-
110
-
111
-
112
-
113
-
114
-
115
-
116
-
117
-
118
-
119
-
120
-
121
-
122
-
123
-
124
-
125
-
126
-
127
-
128
-
129
-
130
-
131
-
132
-
133
-
134
-
135
-
136
-
137
-
138
-
139
-
140
-
141
-
142
-
143
-
144
-
145
-
146
-
147
-
148
-
149
-
150
-
151
-
152
-
153
-
154
-
155
-
156
-
157
-
158
-
159
-
160
-
161
-
162
-
163
-
 164
164 -
 165
165 -
 166
166 -
 167
167 -
 168
168 -
 169
169 -
 170
170 -
 171
171 -
 172
172 -
 173
173 -
 174
174 -
 175
175 -
 176
176 -
 177
177 -
 178
178 -
 179
179 -
 180
180 -
 181
181 -
 182
182 -
 183
183 -
 184
184 -
185
-
186
-
187
-
188
-
189
-
190
-
191
-
192
-
193
-
194
-
195
-
196
-
197
-
198
-
199
-
200
-
201
-
202
-
203
-
204
-
205
-
206
-
207
 |
 |

SLM CORPORATION
NOTES TO CONSOLIDATED FINANCIAL STATEMENTS (Continued)
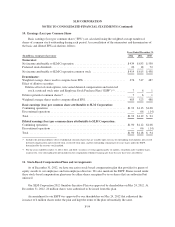
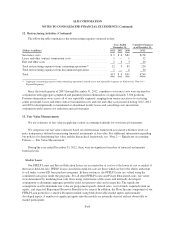
12. Restructuring Activities (Continued)
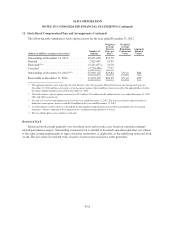
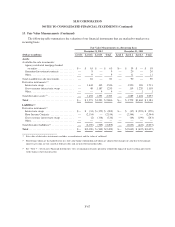
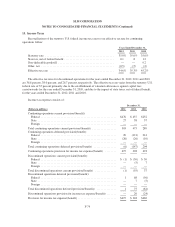
The following table summarizes the restructuring expenses incurred to date.
(Dollars in millions)
Years Ended
December 31,
Cumulative Expense
as of December 31,
2012 2011 2010 2012
Severance costs .............................................. $ 9 $ 6 $81 $178
Lease and other contract termination costs ......................... 1 — 1 12
Exit and other costs ........................................... 2 3 3 20
Total restructuring expenses from continuing operations(1) ............ 12 9 85 210
Total restructuring expenses from discontinued operations ............ 1 — 6 30
Total ....................................................... $13 $ 9 $91 $240
(1) Aggregate restructuring expenses from continuing operations incurred across our reportable segments are disclosed in “Note 16—
Segment Reporting.”
Since the fourth quarter of 2007 through December 31, 2012, cumulative severance costs were incurred in
conjunction with aggregate completed and planned position eliminations of approximately 5,500 positions.
Position eliminations were across all of our reportable segments, ranging from senior executives to servicing
center personnel. Lease and other contract termination costs and exit and other costs incurred during 2012, 2011
and 2010 related primarily to terminated or abandoned facility leases and consulting costs incurred in
conjunction with various cost reduction and exit strategies.
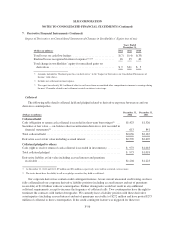
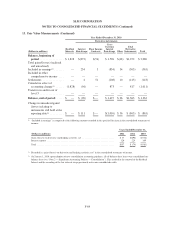
13. Fair Value Measurements
We use estimates of fair value in applying various accounting standards for our financial statements.
We categorize our fair value estimates based on a hierarchical framework associated with three levels of
price transparency utilized in measuring financial instruments at fair value. For additional information regarding
our policies for determining fair value and the hierarchical framework, see “Note 2 — Significant Accounting
Policies — Fair Value Measurement.”
During the year ended December 31, 2012, there were no significant transfers of financial instruments
between levels.
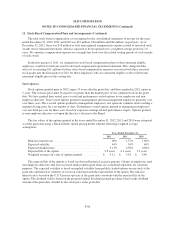
Student Loans
Our FFELP Loans and Private Education Loans are accounted for at cost or at the lower of cost or market if
the loan is held-for-sale. FFELP Loans classified as held-for-sale are those which we have the ability and intent
to sell under various ED loan purchase programs. In these instances, the FFELP Loans are valued using the
committed sales price under the programs. For all other FFELP Loans and Private Education Loans, fair values
were determined by modeling loan cash flows using stated terms of the assets and internally-developed
assumptions to determine aggregate portfolio yield, net present value and average life. The significant
assumptions used to determine fair value are prepayment speeds, default rates, cost of funds, required return on
equity, and expected Repayment Borrower Benefits to be earned. In addition, the Floor Income component of our
FFELP Loan portfolio is valued with option models using both observable market inputs and internally
developed inputs. A number of significant inputs into the models are internally derived and not observable to
market participants.
F-64