Sallie Mae 2012 Annual Report Download - page 188
Download and view the complete annual report
Please find page 188 of the 2012 Sallie Mae annual report below. You can navigate through the pages in the report by either clicking on the pages listed below, or by using the keyword search tool below to find specific information within the annual report.-
 1
1 -
2
-
3
-
4
-
5
-
6
-
7
-
8
-
9
-
10
-
11
-
12
-
13
-
14
-
15
-
16
-
17
-
18
-
19
-
20
-
21
-
22
-
23
-
24
-
25
-
26
-
27
-
28
-
29
-
30
-
31
-
32
-
33
-
34
-
35
-
36
-
37
-
38
-
39
-
40
-
41
-
42
-
43
-
44
-
45
-
46
-
47
-
48
-
49
-
50
-
51
-
52
-
53
-
54
-
55
-
56
-
57
-
58
-
59
-
60
-
61
-
62
-
63
-
64
-
65
-
66
-
67
-
68
-
69
-
70
-
71
-
72
-
73
-
74
-
75
-
76
-
77
-
78
-
79
-
80
-
81
-
82
-
83
-
84
-
85
-
86
-
87
-
88
-
89
-
90
-
91
-
92
-
93
-
94
-
95
-
96
-
97
-
98
-
99
-
100
-
101
-
102
-
103
-
104
-
105
-
106
-
107
-
108
-
109
-
110
-
111
-
112
-
113
-
114
-
115
-
116
-
117
-
118
-
119
-
120
-
121
-
122
-
123
-
124
-
125
-
126
-
127
-
128
-
129
-
130
-
131
-
132
-
133
-
134
-
135
-
136
-
137
-
138
-
139
-
140
-
141
-
142
-
143
-
144
-
145
-
146
-
147
-
148
-
149
-
150
-
151
-
152
-
153
-
154
-
155
-
156
-
157
-
158
-
159
-
160
-
161
-
162
-
163
-
164
-
165
-
166
-
167
-
168
-
169
-
170
-
171
-
172
-
173
-
174
-
175
-
176
-
177
-
 178
178 -
 179
179 -
 180
180 -
 181
181 -
 182
182 -
 183
183 -
 184
184 -
 185
185 -
 186
186 -
 187
187 -
 188
188 -
 189
189 -
 190
190 -
 191
191 -
 192
192 -
 193
193 -
 194
194 -
 195
195 -
 196
196 -
 197
197 -
 198
198 -
199
-
200
-
201
-
202
-
203
-
204
-
205
-
206
-
207
 |
 |
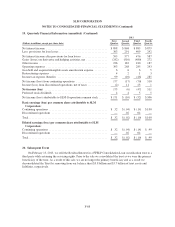
SLM CORPORATION
NOTES TO CONSOLIDATED FINANCIAL STATEMENTS (Continued)
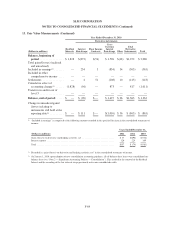
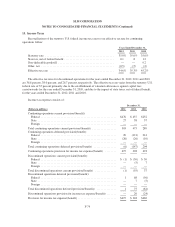
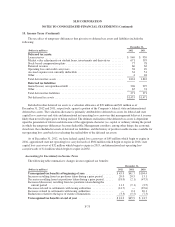
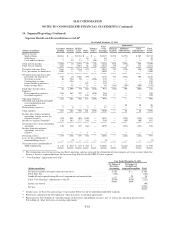
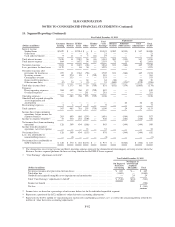
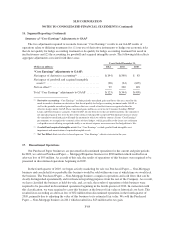
16. Segment Reporting (Continued)
Our primary Business Services activities that are not directly related to the FFELP include:
Upromise
Upromise generates revenue by providing program management services for 529 college-savings plans with
assets of $44.7 billion in 31 college-savings plans in 16 states at December 31, 2012. We also generate
transaction fees through our Upromise consumer savings network; through December 31, 2012, members have
earned approximately $730 million in rewards by purchasing products at hundreds of online retailers, booking
travel, purchasing a home, dining out, buying gas and groceries, using the Upromise World MasterCard, or
completing other qualified transactions. We earn a fee for the marketing and administrative services we provide
to companies that participate in the Upromise savings network. We compete for 529 college-savings plan
business with a large array of banks, financial services and other processing companies. We also compete with
other loyalty shopping services and companies.
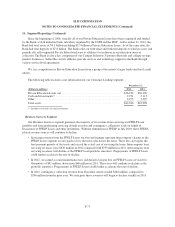
ED Collection and Servicing Contracts
Since 1997, we have provided collection services on defaulted student loans to ED. The current contract
runs through December 31, 2013, with one six-month renewal option by ED. There are 21 other collection
providers, of which we compete with 16 providers for account allocation based on quarterly performance metrics.
The remaining five providers are small businesses who are ensured a particular allocation of business. As a
consistent top performer, our share of allocated accounts has ranged from six percent to eight percent for this
contract period. In addition, we were ranked first in the last quarterly performance metric and have been ranked
first in the long-term performance metric, which is based on the past seven quarterly performance metrics, since
the commencement of this contract.
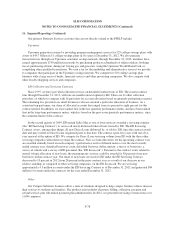
In the second quarter of 2009, ED named Sallie Mae as one of four servicers awarded a servicing contract
(the “ED Servicing Contract”) to service all newly disbursed federal loans owned by ED. The ED Servicing
Contract covers, among other things, all new Direct Loans disbursed by, or sold to, ED since the contract award
date and may extend to Direct Loans originated prior to that date. The contract spans five years with one, five-
year renewal at the option of ED. We compete for Direct Loan servicing volume from ED with the three other
servicing companies with whom we share the contract. New account allocations for the upcoming contract year
are awarded annually based on each company’s performance on five different metrics over the most recently
ended contract year: defaulted borrower count, defaulted borrower dollar amount, a survey of borrowers, a
survey of schools and a survey of ED personnel (the “ED Scorecard”). Pursuant to the contract terms related to
annual volume allocation of new loans, the maximum any servicer could be awarded is 40 percent of net new
borrowers in that contract year. Our share of new loans serviced for ED under the ED Servicing Contract
decreased to 15 percent in 2012 from 26 percent in the prior contract year as a result of our decrease in our
relative standing, as compared to other servicing companies, on the ED Scorecard. We are servicing
approximately 4.3 million accounts under the ED Servicing Contract as of December 31, 2012 and generated $84
million of revenue under the contracts for the year ended December 31, 2012.
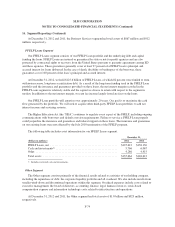
Other
Our Campus Solutions business offers a suite of solutions designed to help campus business offices increase
their services to students and families. The product suite includes electronic billing, collection, payment and
refund services plus full tuition payment plan administration. In 2012, we generated servicing revenue from over
1,000 campuses.
F-78