Sallie Mae 2012 Annual Report Download - page 84
Download and view the complete annual report
Please find page 84 of the 2012 Sallie Mae annual report below. You can navigate through the pages in the report by either clicking on the pages listed below, or by using the keyword search tool below to find specific information within the annual report.-
 1
1 -
2
-
3
-
4
-
5
-
6
-
7
-
8
-
9
-
10
-
11
-
12
-
13
-
14
-
15
-
16
-
17
-
18
-
19
-
20
-
21
-
22
-
23
-
24
-
25
-
26
-
27
-
28
-
29
-
30
-
31
-
32
-
33
-
34
-
35
-
36
-
37
-
38
-
39
-
40
-
41
-
42
-
43
-
44
-
45
-
46
-
47
-
48
-
49
-
50
-
51
-
52
-
53
-
54
-
55
-
56
-
57
-
58
-
59
-
60
-
61
-
62
-
63
-
64
-
65
-
66
-
67
-
68
-
69
-
70
-
71
-
72
-
73
-
 74
74 -
 75
75 -
 76
76 -
 77
77 -
 78
78 -
 79
79 -
 80
80 -
 81
81 -
 82
82 -
 83
83 -
 84
84 -
 85
85 -
 86
86 -
 87
87 -
 88
88 -
 89
89 -
 90
90 -
 91
91 -
 92
92 -
 93
93 -
 94
94 -
95
-
96
-
97
-
98
-
99
-
100
-
101
-
102
-
103
-
104
-
105
-
106
-
107
-
108
-
109
-
110
-
111
-
112
-
113
-
114
-
115
-
116
-
117
-
118
-
119
-
120
-
121
-
122
-
123
-
124
-
125
-
126
-
127
-
128
-
129
-
130
-
131
-
132
-
133
-
134
-
135
-
136
-
137
-
138
-
139
-
140
-
141
-
142
-
143
-
144
-
145
-
146
-
147
-
148
-
149
-
150
-
151
-
152
-
153
-
154
-
155
-
156
-
157
-
158
-
159
-
160
-
161
-
162
-
163
-
164
-
165
-
166
-
167
-
168
-
169
-
170
-
171
-
172
-
173
-
174
-
175
-
176
-
177
-
178
-
179
-
180
-
181
-
182
-
183
-
184
-
185
-
186
-
187
-
188
-
189
-
190
-
191
-
192
-
193
-
194
-
195
-
196
-
197
-
198
-
199
-
200
-
201
-
202
-
203
-
204
-
205
-
206
-
207
 |
 |

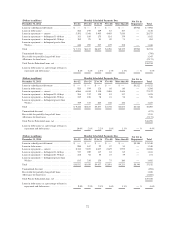
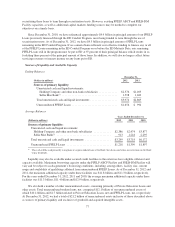
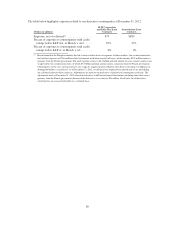
Secured borrowings comprised 84 percent of our “Core Earnings” basis debt outstanding at December 31,
2012 versus 87 percent at December 31, 2011.
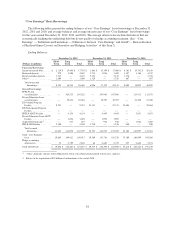
Years Ended December 31,
2012 2011 2010
(Dollars in millions)
Average
Balance
Average
Rate
Average
Balance
Average
Rate
Average
Balance
Average
Rate
Unsecured borrowings:
Senior unsecured debt ............... $ 18,183 2.98% $ 19,562 2.34% $ 24,480 1.70%
Brokered deposits ................... 3,293 1.86 3,660 2.35 5,123 2.65
Retail and other deposits ............. 2,460 .85 1,684 1.11 644 1.16
Other(1) ........................... 1,474 .21 1,187 .17 1,159 .19
Total unsecured borrowings ......... 25,410 2.47 26,093 2.16 31,406 1.79
Secured borrowings:
FFELP Loan securitizations ........... 106,493 1.08 110,474 .93 100,967 .87
Private Education Loan securitizations . . 19,322 2.10 20,976 2.17 21,367 2.13
ED Conduit Program Facility ......... 16,118 .82 22,869 .75 15,096 .70
ED Participation Program Facility ...... — — — — 13,537 .81
FFELP ABCP Facility ............... 4,733 1.03 4,989 1.05 6,623 1.24
Private Education Loan ABCP
Facility ......................... 1,880 1.77 272 2.08 — —
Acquisition financing(2) .............. 791 4.83 998 4.81 3 5.28
FHLB-DM Facility .................. 1,481 .34 893 .25 403 .35
Total secured borrowings ........... 150,818 1.20 161,471 1.09 157,996 1.03
Total ............................. $ 176,228 1.39% $ 187,564 1.24% $ 189,402 1.16%
“Core Earnings” average balance and
rate ............................ $ 176,228 1.39% $ 187,564 1.24% $ 189,402 1.16%
Adjustment for GAAP accounting
treatment ........................ — .06 — .04 — .04
GAAP-basis average balance and rate . . . $ 176,228 1.45% $ 187,564 1.28% $ 189,402 1.20%
(1) “Other” primarily consists of the obligation to return cash collateral held related to derivative exposure.
(2) Relates to the acquisition of $25 billion of student loans at the end of 2010.
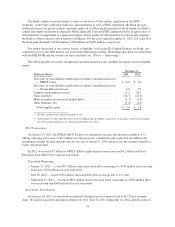
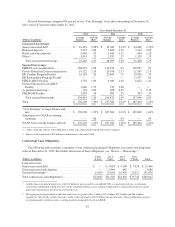
Contractual Cash Obligations
The following table provides a summary of our contractual principal obligations associated with long-term
notes at December 31, 2012. For further discussion of these obligations, see “Note 6 — Borrowings.”
(Dollars in millions)
1 Year
or Less
1to3
Years
3to5
Years
Over
5 Years Total
Long-term notes:
Senior unsecured debt ............................. $ — $ 4,018 $ 4,100 $ 7,328 $ 15,446
Unsecured term bank deposits ....................... — 2,446 642 — 3,088
Secured borrowings(1) .............................. 13,655 25,056 19,950 72,417 131,078
Total contractual cash obligations(2) ................... $13,655 $31,520 $24,692 $79,745 $149,612
(1) Includes long-term beneficial interests of $125.2 billion of notes issued by consolidated VIEs in conjunction with our securitization
transactions and included in long-term notes in the consolidated balance sheet. Timing of obligations is estimated based on our current
projection of prepayment speeds of the securitized assets.
(2) The aggregate principal amount of debt that matures in each period is $13.7 billion, $31.6 billion, $24.9 billion and $80.3 billion,
respectively. Specifically excludes derivative market value adjustments of $2.8 billion for long-term notes. Interest obligations on notes
are predominantly variable in nature, resetting monthly and quarterly based on LIBOR.
82