Sallie Mae 2012 Annual Report Download - page 57
Download and view the complete annual report
Please find page 57 of the 2012 Sallie Mae annual report below. You can navigate through the pages in the report by either clicking on the pages listed below, or by using the keyword search tool below to find specific information within the annual report.-
 1
1 -
2
-
3
-
4
-
5
-
6
-
7
-
8
-
9
-
10
-
11
-
12
-
13
-
14
-
15
-
16
-
17
-
18
-
19
-
20
-
21
-
22
-
23
-
24
-
25
-
26
-
27
-
28
-
29
-
30
-
31
-
32
-
33
-
34
-
35
-
36
-
37
-
38
-
39
-
40
-
41
-
42
-
43
-
44
-
45
-
46
-
 47
47 -
 48
48 -
 49
49 -
 50
50 -
 51
51 -
 52
52 -
 53
53 -
 54
54 -
 55
55 -
 56
56 -
 57
57 -
 58
58 -
 59
59 -
 60
60 -
 61
61 -
 62
62 -
 63
63 -
 64
64 -
 65
65 -
 66
66 -
 67
67 -
68
-
69
-
70
-
71
-
72
-
73
-
74
-
75
-
76
-
77
-
78
-
79
-
80
-
81
-
82
-
83
-
84
-
85
-
86
-
87
-
88
-
89
-
90
-
91
-
92
-
93
-
94
-
95
-
96
-
97
-
98
-
99
-
100
-
101
-
102
-
103
-
104
-
105
-
106
-
107
-
108
-
109
-
110
-
111
-
112
-
113
-
114
-
115
-
116
-
117
-
118
-
119
-
120
-
121
-
122
-
123
-
124
-
125
-
126
-
127
-
128
-
129
-
130
-
131
-
132
-
133
-
134
-
135
-
136
-
137
-
138
-
139
-
140
-
141
-
142
-
143
-
144
-
145
-
146
-
147
-
148
-
149
-
150
-
151
-
152
-
153
-
154
-
155
-
156
-
157
-
158
-
159
-
160
-
161
-
162
-
163
-
164
-
165
-
166
-
167
-
168
-
169
-
170
-
171
-
172
-
173
-
174
-
175
-
176
-
177
-
178
-
179
-
180
-
181
-
182
-
183
-
184
-
185
-
186
-
187
-
188
-
189
-
190
-
191
-
192
-
193
-
194
-
195
-
196
-
197
-
198
-
199
-
200
-
201
-
202
-
203
-
204
-
205
-
206
-
207
 |
 |

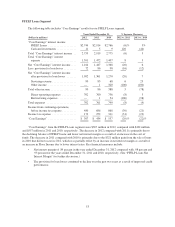
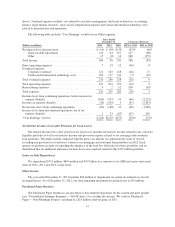
amortization and $8 million of non-cash debt discount amortization during 2012. This combined $50 million
acceleration of non-cash amortization related to this activity reduced the FFELP Loans net interest margin by 4
basis points for the year ended December 31, 2012.
On December 23, 2011, the President signed the Consolidated Appropriations Act of 2012 into law. This
law includes changes that permit FFELP lenders or beneficial holders to change the index on which the Special
Allowance Payments (“SAP”) are calculated for FFELP Loans first disbursed on or after January 1, 2000. We
elected to use the one-month LIBOR rate rather than the CP rate commencing on April 1, 2012 in connection
with our entire $128 billion of CP indexed loans. This change will help us to better match loan yields with our
financing costs. This election did not materially affect our results for the year ended December 31, 2012.
On December 31, 2010, we acquired $26.1 billion of securitized federal student loans and related assets
from the Student Loan Corporation (“SLC”), a subsidiary of Citibank, N.A., for approximately $1.1 billion.
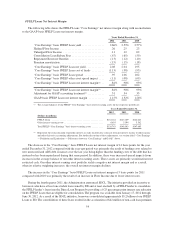
As of December 31, 2012, our FFELP Loan portfolio totaled approximately $125.6 billion, comprised of
$44.3 billion of FFELP Stafford and $81.3 billion of FFELP Consolidation Loans. The weighted-average life of
these portfolios is 4.9 years and 9.9 years, respectively, assuming a Constant Prepayment Rate (“CPR”) of
4 percent and 3 percent, respectively.
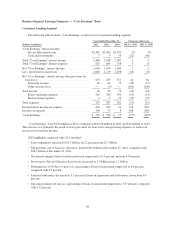
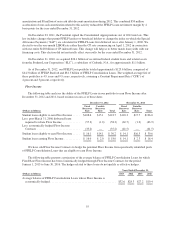
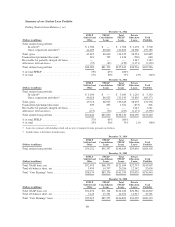
Floor Income
The following table analyzes the ability of the FFELP Loans in our portfolio to earn Floor Income after
December 31, 2012 and 2011, based on interest rates as of those dates.
December 31, 2012 December 31, 2011
(Dollars in billions)
Fixed
Borrower
Rate
Variable
Borrower
Rate Total
Fixed
Borrower
Rate
Variable
Borrower
Rate Total
Student loans eligible to earn Floor Income ..... $108.6 $15.1 $123.7 $118.3 $17.7 $136.0
Less: post-March 31, 2006 disbursed loans
required to rebate Floor Income ............ (57.3) (1.0) (58.3) (62.7) (1.2) (63.9)
Less: economically hedged Floor Income
Contracts .............................. (35.2) — (35.2) (41.5) — (41.5)
Student loans eligible to earn Floor Income ..... $ 16.1 $14.1 $ 30.2 $ 14.1 $16.5 $ 30.6
Student loans earning Floor Income ........... $ 16.0 $ 2.0 $ 18.0 $ 14.1 $ 2.3 $ 16.4
We have sold Floor Income Contracts to hedge the potential Floor Income from specifically identified pools
of FFELP Consolidation Loans that are eligible to earn Floor Income.
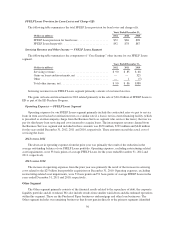
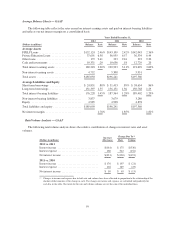
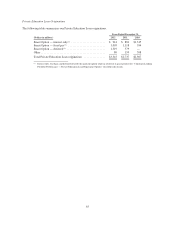
The following table presents a projection of the average balance of FFELP Consolidation Loans for which
Fixed Rate Floor Income has been economically hedged through Floor Income Contracts for the period
January 1, 2013 to June 30, 2016. The hedges related to these loans do not qualify as effective hedges.
Years Ended December 31,
(Dollars in billions) 2013 2014 2015 2016
Average balance of FFELP Consolidation Loans whose Floor Income is
economically hedged .............................................. $32.6 $28.3 $27.2 $10.4
55